Long-Run Aggregate Supply (LRAS) Curve — Classical
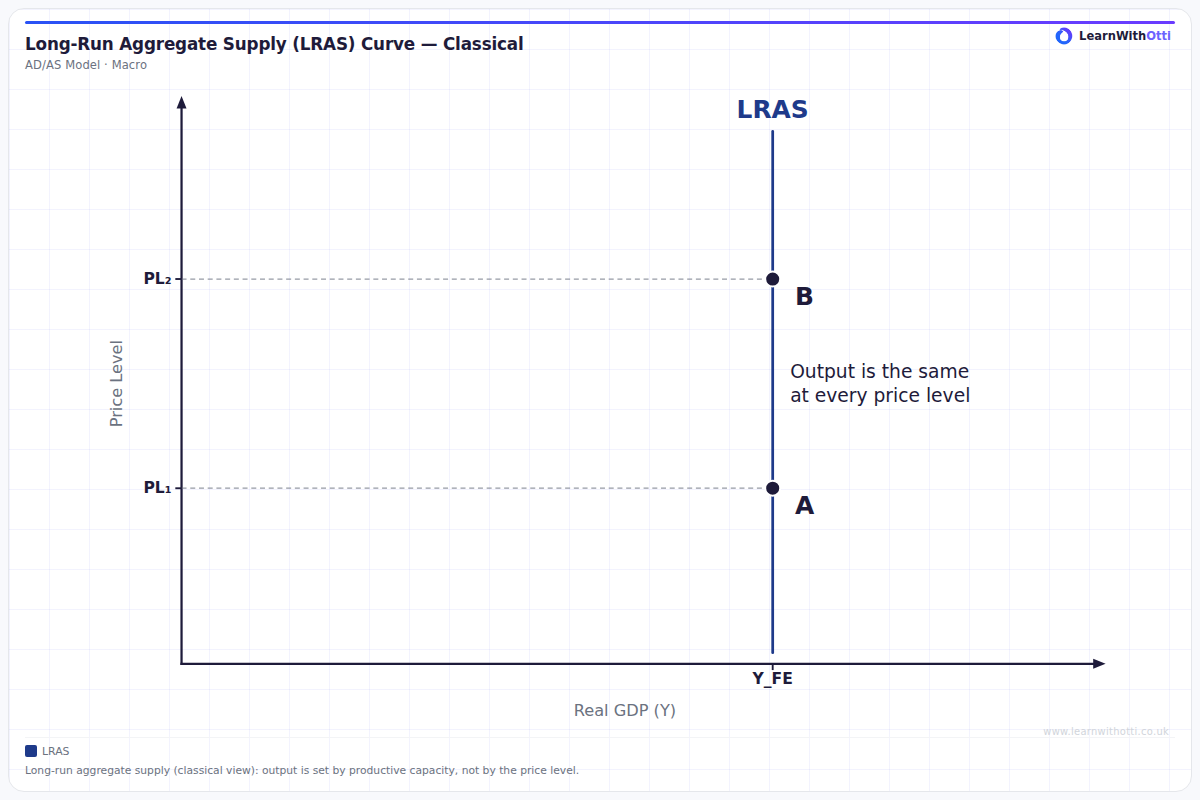
The classical long-run aggregate supply curve: a vertical line at full-capacity output (Y_FE). Two price levels, PL1 and PL2, give the same output, because long-run output is set by productive capacity, not by the price level.
Printable preview
Download a static PNG of this diagram to print or include in revision notes.
Download PNGWhat this diagram shows
This diagram shows the classical view of long-run aggregate supply. LRAS is a vertical line at Y_FE, the level of real output the economy can produce when all its factors of production are fully employed. Points A and B are at different price levels, PL1 and PL2, but at the same level of output. In the classical view, long-run output is fixed by the quantity and quality of the factors of production (land, labour, capital and enterprise) and by the technology used to combine them. In the long run, wages and other costs adjust fully to the price level, so a higher price level does not make extra output more profitable, and the price level does not change long-run output. The LRAS curve shifts only when productive capacity changes: for example, more or better-trained workers, more capital, or new technology shift it to the right, and a loss of factors of production shifts it to the left.
Key points
- In the classical view, LRAS is vertical at full-capacity output, Y_FE.
- Long-run output is fixed by the quantity and quality of the factors of production and by technology.
- The price level does not change long-run output: every price level gives the same output on LRAS.
- In the long run, wages and other costs adjust fully to the price level, so a higher price level does not make extra output profitable.
- Changes in productive capacity shift LRAS: rightwards when capacity grows, leftwards when it shrinks.
Exam tip
Draw the classical LRAS as a vertical line and label the point where it meets the output axis as full-capacity (full-employment) output, Y_FE. To show that the price level does not change long-run output, put two different price levels on the line and point out that both give the same output. Show a change in productive capacity by shifting the whole line left or right, never by moving along it.
Common mistakes
A common mistake is to draw LRAS sloping upwards like SRAS. In the classical view it is vertical, because the price level does not change long-run output. Another is to think a rise in the price level, or in aggregate demand, can raise long-run output: on a vertical LRAS it changes only the price level. A third is to shift LRAS for something that changes only firms' short-run costs, such as a temporary rise in oil prices; that shifts SRAS. LRAS shifts only when the economy's productive capacity changes.
Related diagrams
Ask Otti about this diagram
Our AI tutor can walk you through every curve, explain exam technique, and quiz you on it.