Short-Run Aggregate Supply (SRAS) Curve
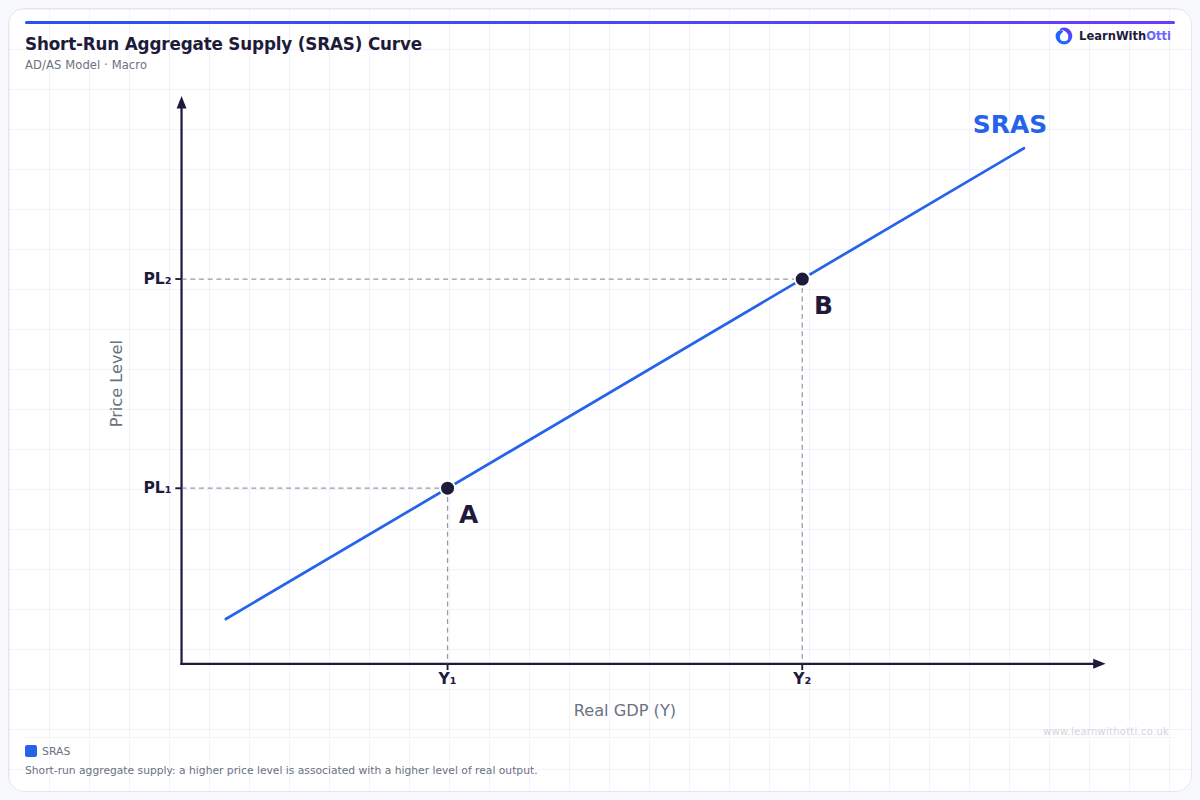
A single upward-sloping short-run aggregate supply curve with two points: at a higher price level (PL2) firms supply a higher level of real output (Y2) than at PL1. A change in the price level is a movement along the curve.
Printable preview
Download a static PNG of this diagram to print or include in revision notes.
Download PNGWhat this diagram shows
This diagram shows a single short-run aggregate supply curve, SRAS. It slopes upwards: at point A the price level is PL1 and real output is Y1, and at point B the price level is higher, PL2, and real output is higher too, Y2. The curve slopes upwards because in the short run many of firms' costs, especially money wages, are slow to change. Wages are often fixed by contracts and are renegotiated only from time to time. When the price level rises, firms receive higher prices for their output while their costs stay roughly the same, so producing extra output becomes more profitable and they supply more. A change in the price level is therefore a movement along the SRAS curve, from A to B or back. A change in firms' costs of production, such as higher wages, more expensive imported raw materials or a rise in business taxes, shifts the whole SRAS curve instead.
Key points
- SRAS shows the total real output firms in the economy are willing to supply at each price level in the short run.
- It slopes upwards: a higher price level is associated with a higher level of real output.
- In the short run, costs such as money wages are slow to change, so a higher price level makes extra output profitable.
- A change in the price level causes a movement along the SRAS curve, not a shift.
- A change in firms' costs of production, such as wages, raw material prices or business taxes, shifts the whole SRAS curve.
Exam tip
When you draw SRAS, label the axes "Price level" and "Real output" (or real GDP), not price and quantity, because the diagram describes the whole economy rather than one market. Then decide what has changed. If only the price level has changed, show a movement along the existing SRAS curve. If firms' costs have changed, for example wages, raw material prices or business taxes, shift the whole curve instead.
Common mistakes
A common mistake is to shift the SRAS curve when the price level changes. A change in the price level is a movement along the curve; only a change in firms' costs shifts it. Another is to label the axes "Price" and "Quantity": the vertical axis is the average price level and the horizontal axis is real output for the whole economy. A third is to explain the upward slope with the law of supply for a single good. SRAS slopes upwards because costs, especially wages, are slow to adjust in the short run, so a higher price level raises the profitability of extra output.
Related diagrams
Ask Otti about this diagram
Our AI tutor can walk you through every curve, explain exam technique, and quiz you on it.