SRAS Shift Left (Negative Supply Shock)
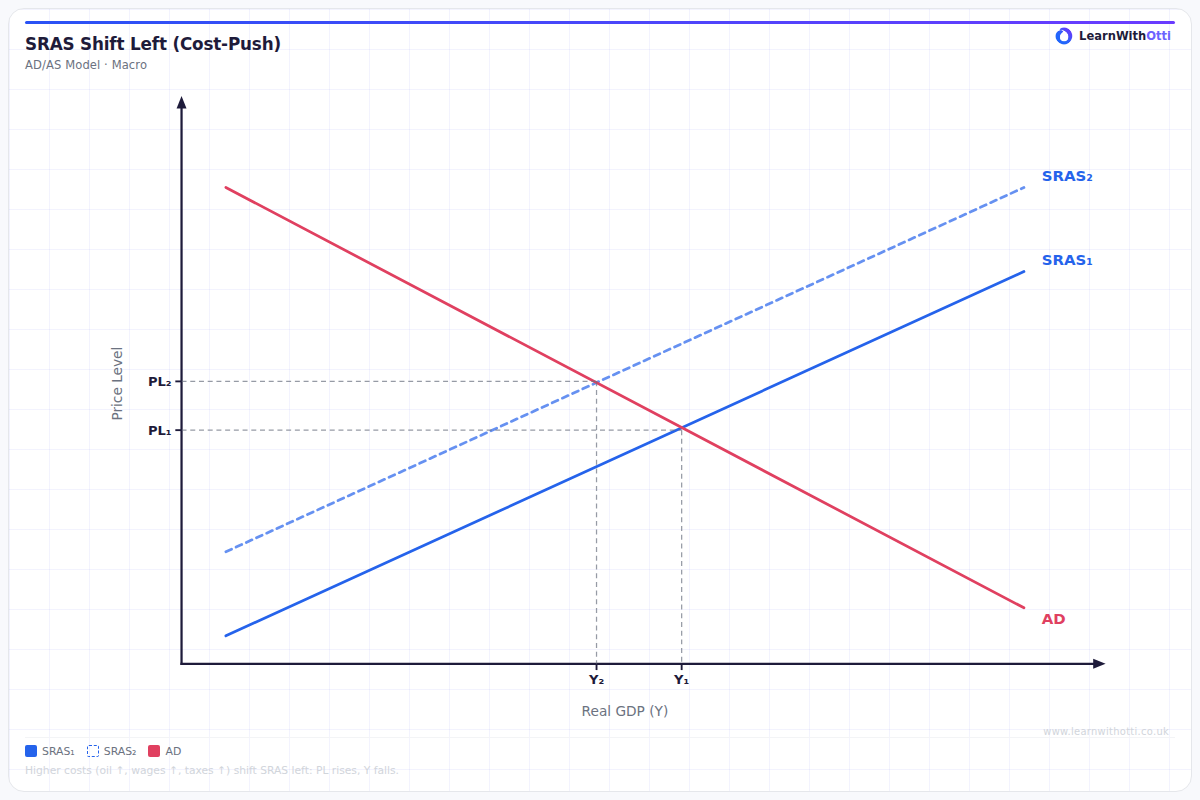
AD/AS diagram showing a leftward SRAS shift due to rising input costs or supply disruption, causing stagflation — higher price level and lower real output.
Printable preview
Download a static PNG of this diagram to print or include in revision notes.
Download PNGWhat this diagram shows
A leftward shift of the Short-Run Aggregate Supply (SRAS) curve represents a negative supply shock, where firms face higher production costs or reduced productive capacity. This shift shows that at every price level, businesses are now willing and able to supply less output than before. The result is stagflation - a combination of higher prices and lower real GDP, creating both inflationary pressure and economic contraction simultaneously. This is particularly problematic for policymakers as it presents a trade-off between controlling inflation and supporting economic growth.
Key points
- SRAS shifts left due to increases in production costs (wages, raw materials, energy) or supply chain disruptions
- Movement from original equilibrium shows higher price level and lower real GDP - demonstrating stagflation
- Common causes include oil price shocks, natural disasters, trade wars, or significant wage increases
- Creates a policy dilemma: expansionary policy risks higher inflation, contractionary policy worsens recession
- In the long run, the economy may self-correct as wages and prices adjust, but this process can be slow and painful
Exam tip
Always explain both the immediate short-run effects AND the potential long-run adjustments when discussing SRAS shifts. Examiners are impressed when students can link the leftward SRAS shift to specific real-world examples like oil price shocks or supply chain disruptions, showing practical application of theory.
Common mistakes
Students often confuse movements along the SRAS curve (caused by price level changes) with shifts of the entire curve (caused by supply-side factors). Many also forget to explain that this creates stagflation, focusing only on either the price increase or output decrease rather than both occurring simultaneously.
Exam board notes
All major exam boards treat this diagram identically, emphasizing the importance of distinguishing between supply-side shocks (shifts) and demand-side changes (movements along curves). However, OCR tends to place slightly more emphasis on discussing the policy implications and trade-offs created by negative supply shocks.
Related diagrams
Ask Otti about this diagram
Our AI tutor can walk you through every curve, explain exam technique, and quiz you on it.