Perfect Competition: Short-Run Supernormal Profit
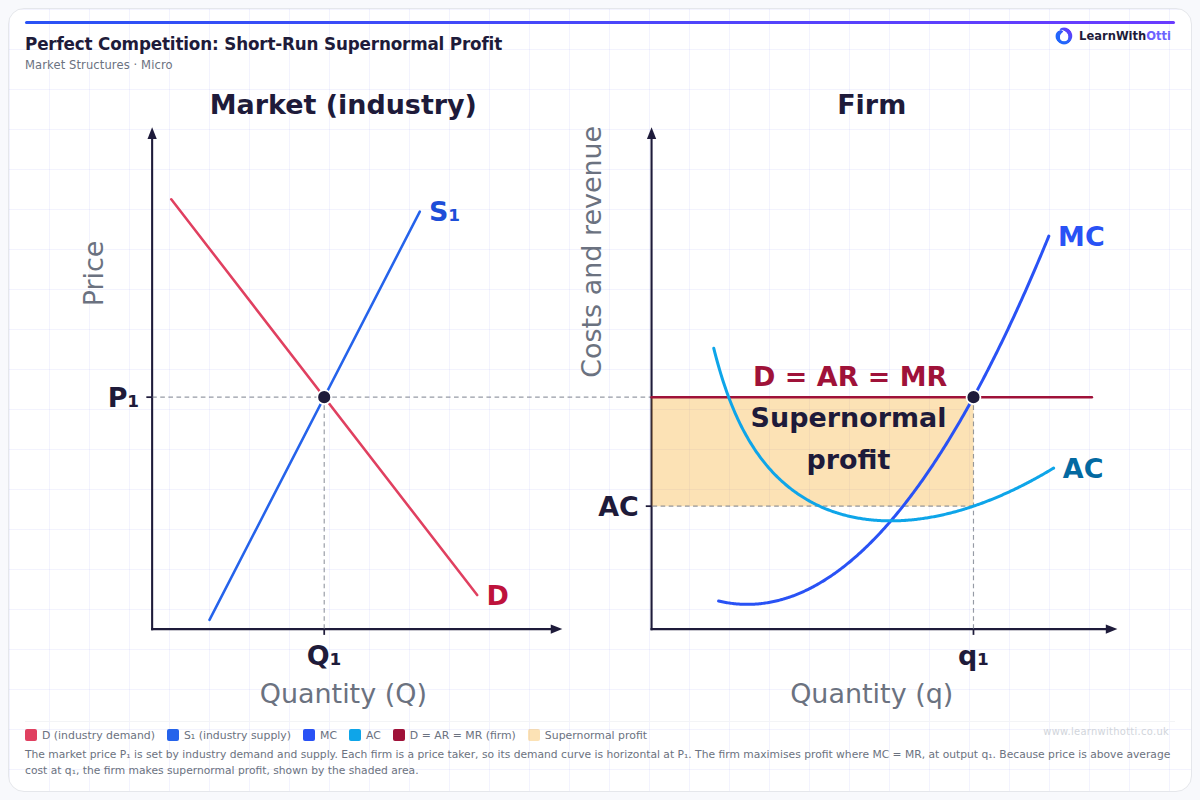
Two-panel diagram with the market on the left and the firm on the right, on one price scale. Industry demand and supply set the market price P₁, carried across to the firm as its horizontal demand curve D = AR = MR. The firm produces q₁ where MC = MR on the rising part of MC, and because AC at q₁ is below P₁ it makes supernormal profit, shaded as (P₁ − AC) × q₁.
Printable preview
Download a static PNG of this diagram to print or include in revision notes.
Download PNGWhat this diagram shows
This diagram links a perfectly competitive market to one firm in it. Industry demand and supply set the market price P₁, and because each firm is a price taker it can sell any quantity at P₁, so its demand curve is horizontal at that price: D = AR = MR. The firm maximises profit where MC = MR, at output q₁ on the rising part of its MC curve. At q₁ price is above average cost, so the firm makes supernormal profit, shown by the shaded rectangle (P₁ − AC) × q₁.
Key points
- The market price P₁ is set where industry demand meets industry supply, and each firm takes this price as given.
- The firm's demand curve is perfectly elastic at P₁, so price = AR = MR at every level of output.
- Profit is maximised where MC = MR, at output q₁, on the rising part of the MC curve.
- Supernormal profit = (P₁ − AC) × q₁, using AC at q₁, not the minimum of AC.
- MC cuts AC at its minimum point. With no barriers to entry, this supernormal profit attracts new firms in the long run.
Exam tip
Draw the market and the firm side by side on the same price scale, and carry the market price across with a dashed line: that link is what makes the firm a price taker. Mark q₁ where MC = MR on the rising part of MC, then read AC directly above q₁, not at the lowest point of AC. Supernormal profit is (P₁ − AC) × q₁, the rectangle between those two heights out to q₁.
Common mistakes
Drawing the firm's demand curve sloping downwards, or at a different price from the market, breaks the price-taker link: it must be horizontal at the market price. Students also measure profit from the wrong height, using MC or the lowest point of AC instead of AC at the profit-maximising output q₁.
Related diagrams
Ask Otti about this diagram
Our AI tutor can walk you through every curve, explain exam technique, and quiz you on it.