Perfect Competition: Long-Run Adjustment
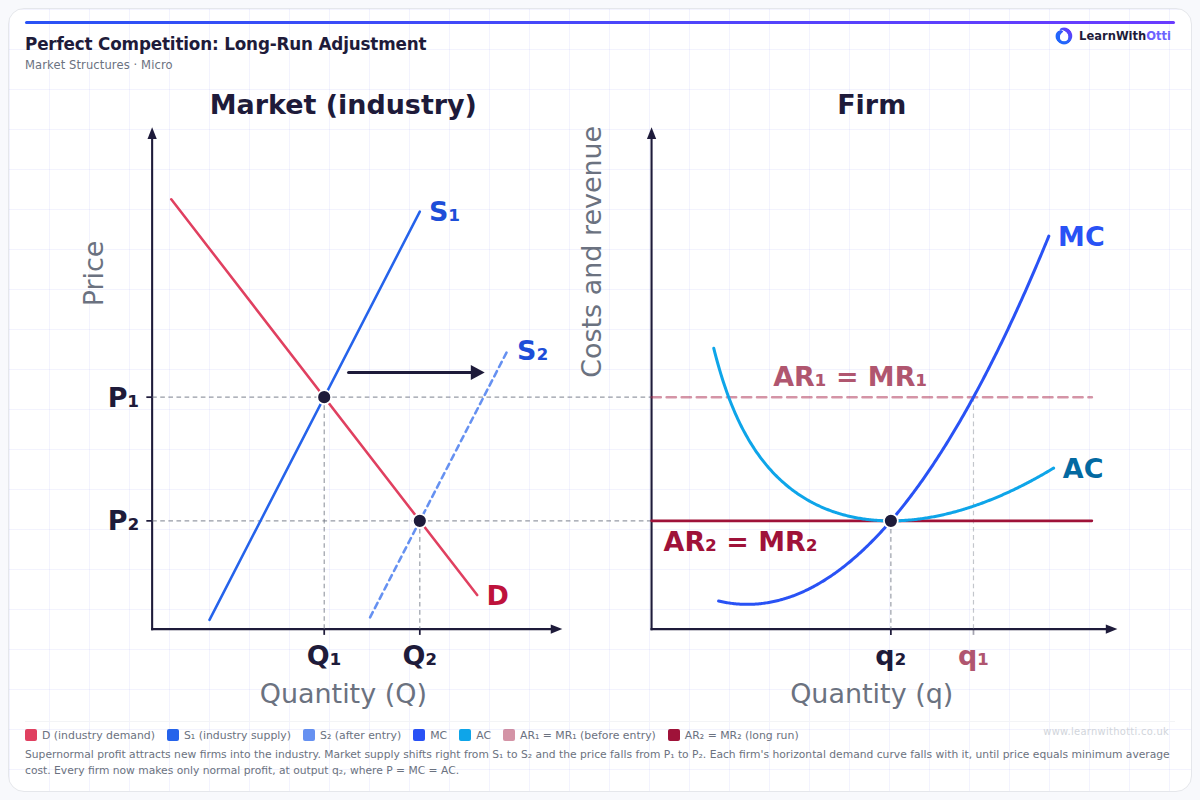
Two-panel diagram with the market on the left and the firm on the right, on one price scale. Supernormal profit attracts entry, so industry supply shifts right from S₁ to S₂ and the price falls from P₁ to P₂. The firm's horizontal demand falls from AR₁ = MR₁ to AR₂ = MR₂, which touches AC at its minimum, so each firm makes normal profit at q₂ where P = MC = AC.
Printable preview
Download a static PNG of this diagram to print or include in revision notes.
Download PNGWhat this diagram shows
This diagram shows how a perfectly competitive industry moves from short-run supernormal profit to long-run equilibrium. Because there are no barriers to entry, supernormal profit at P₁ attracts new firms, so industry supply shifts right from S₁ to S₂ while demand is unchanged. The market price falls from P₁ to P₂ and industry output rises from Q₁ to Q₂. Each firm is a price taker, so its demand curve falls from AR₁ = MR₁ to AR₂ = MR₂; entry stops when price equals minimum average cost, where each firm produces q₂ and makes only normal profit.
Key points
- Supernormal profit at P₁ attracts new firms into the industry, because there are no barriers to entry.
- Entry shifts industry supply right from S₁ to S₂. Demand does not shift, so the price falls from P₁ to P₂ and industry output rises from Q₁ to Q₂.
- Each firm's horizontal AR = MR line falls with the market price, from AR₁ = MR₁ to AR₂ = MR₂.
- In the long run P₂ equals minimum AC, so each firm makes only normal profit at q₂, where P = MC = AC.
- Each firm's output falls from q₁ to q₂, but industry output rises because there are more firms.
Exam tip
Tell the long-run story in order across both panels: supernormal profit attracts new firms, industry supply shifts right from S₁ to S₂, the market price falls from P₁ to P₂, and each firm's horizontal AR = MR line falls with it. The adjustment stops where P₂ equals minimum AC, so AR₂ = MR₂ just touches the bottom of the AC curve and P = MC = AC.
Common mistakes
Stopping the price fall above or below the minimum of AC: in long-run equilibrium AR₂ = MR₂ must touch AC exactly at its lowest point, where MC also cuts it. Students also explain the supply shift as existing firms producing more, when it comes from new firms entering the industry.
Related diagrams
Ask Otti about this diagram
Our AI tutor can walk you through every curve, explain exam technique, and quiz you on it.