Opportunity Cost on a PPF
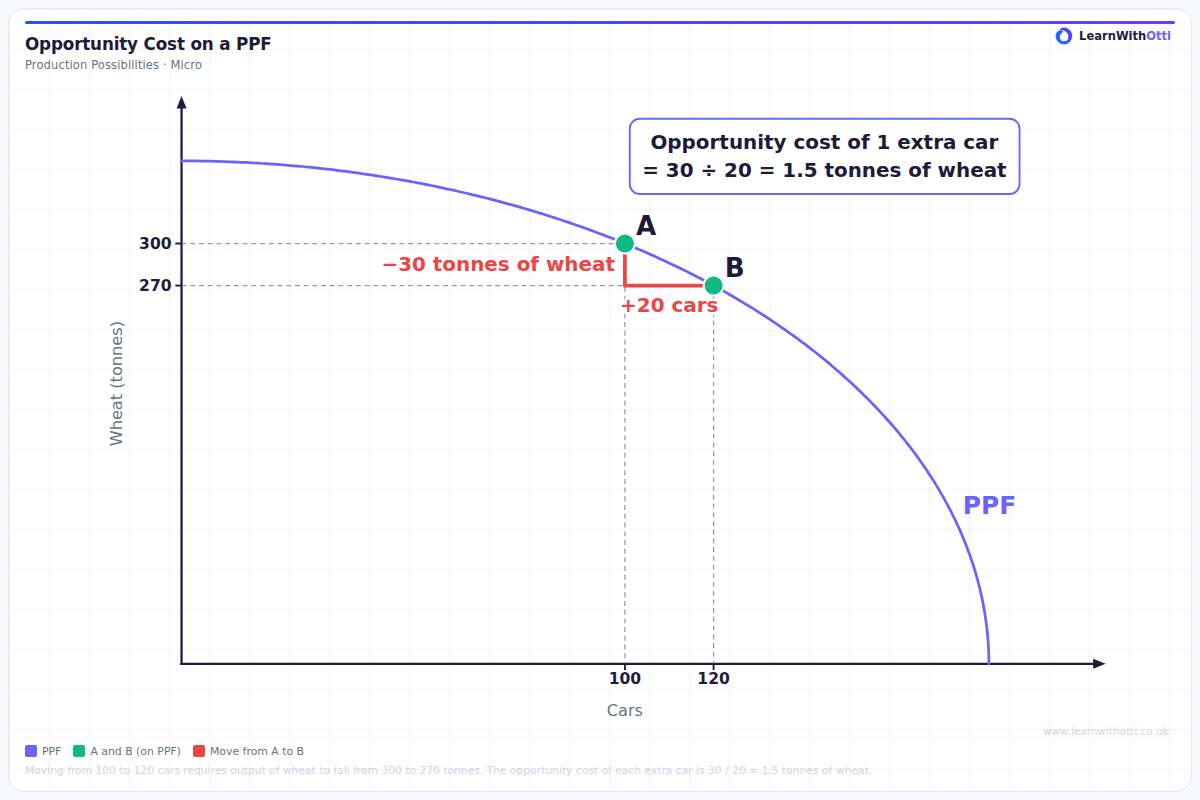
Concave PPF for cars and wheat showing the opportunity cost of a move along the frontier: going from 100 to 120 cars cuts wheat from 300 to 270 tonnes, so each extra car costs 30 / 20 = 1.5 tonnes of wheat.
Printable preview
Download a static PNG of this diagram to print or include in revision notes.
Download PNGWhat this diagram shows
This PPF shows the maximum combinations of cars and wheat an economy can produce with its resources fully and efficiently employed. Points A (100 cars, 300 tonnes of wheat) and B (120 cars, 270 tonnes of wheat) both lie on the frontier, so both are productively efficient. Moving from A to B, output of cars rises by 20 while output of wheat falls by 30 tonnes: resources have to be moved out of wheat to make the extra cars. The opportunity cost of each extra car is therefore 30 / 20 = 1.5 tonnes of wheat. Because the PPF is concave (bowed outwards), this cost is not constant: further moves towards more cars give up ever more wheat per car, since resources suited to farming are less productive in car making.
Key points
- Opportunity cost is the next best alternative forgone; on a PPF it is the amount of the other good given up
- Moving from A (100 cars, 300 tonnes) to B (120 cars, 270 tonnes) gains 20 cars and gives up 30 tonnes of wheat
- Opportunity cost of one extra car = 30 ÷ 20 = 1.5 tonnes of wheat
- Both A and B are on the PPF, so both are productively efficient: more cars can only come from less wheat
- A concave PPF means increasing opportunity cost: each further extra car costs more wheat than the last
Exam tip
Always show the calculation: opportunity cost per unit = what is given up ÷ what is gained. Here, moving from A (100 cars, 300 tonnes of wheat) to B (120 cars, 270 tonnes) gives up 30 tonnes of wheat to gain 20 cars, so each extra car costs 30 ÷ 20 = 1.5 tonnes of wheat. State the units (tonnes of wheat per car) and say which good is being given up.
Common mistakes
Students often divide the wrong way round (20 ÷ 30 gives the opportunity cost of a tonne of wheat in cars, not the cost of a car in wheat), or give the total change (30 tonnes) instead of the cost per extra car. They also forget the units, or describe the move from A to B as a shift of the PPF when it is a movement along the frontier.
Related diagrams
Ask Otti about this diagram
Our AI tutor can walk you through every curve, explain exam technique, and quiz you on it.