PPF — Actual Growth (Using Spare Capacity)
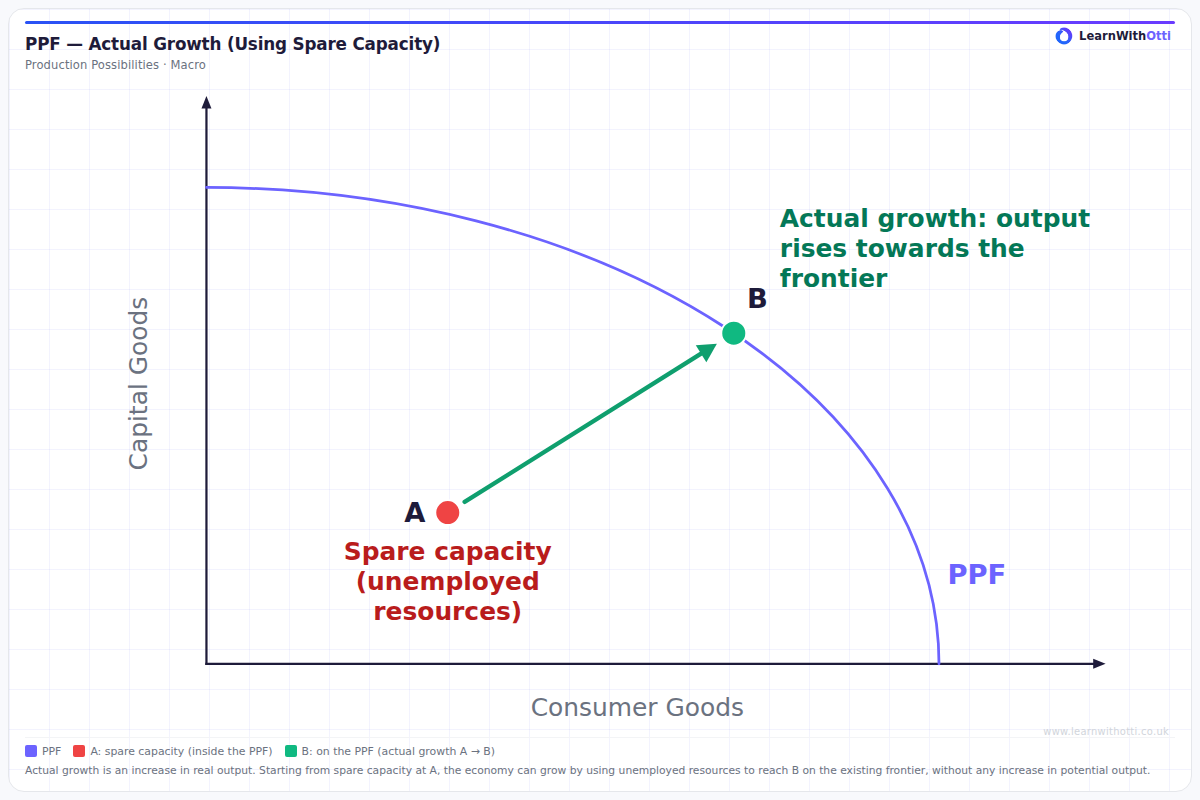
A single concave PPF with point A inside the frontier (spare capacity, unemployed resources) and point B on the frontier to the north-east of A. The move from A to B is actual growth: real output rises by using unemployed resources, with no shift in the frontier.
Printable preview
Download a static PNG of this diagram to print or include in revision notes.
Download PNGWhat this diagram shows
This diagram shows a single production possibility frontier (PPF) for capital goods and consumer goods. Point A lies inside the frontier: the economy has spare capacity, because some resources are unemployed. Point B lies on the frontier to the north-east of A, so at B the economy produces more of both capital goods and consumer goods than at A. The arrow from A to B is actual growth: real output rises as unemployed resources are put to use. The frontier itself does not shift, so the economy's potential output is unchanged.
Key points
- Point A is inside the PPF: the economy has spare capacity, with unemployed resources, so output is below what it could produce.
- Point B is on the PPF, to the north-east of A: more capital goods and more consumer goods are produced than at A.
- The move from A to B is actual growth: an increase in real output from using resources that were unemployed.
- Only one PPF is drawn and it does not shift, so potential output is unchanged; an outward shift of the PPF would show potential growth.
- Spare capacity at A is the PPF view of a negative output gap: actual output is below potential output.
Exam tip
Keep actual growth and potential growth apart. In this diagram the PPF does not move: the economy moves from A, inside the frontier, to B, on it, by using unemployed resources, so real output rises without any increase in potential output. An outward shift of the PPF would show potential growth instead. Say which resources are unemployed at A, for example workers without jobs or machinery standing idle, to explain why A lies inside the frontier.
Common mistakes
Students often describe actual growth as an outward shift of the PPF. In this diagram the frontier does not move: actual growth is the movement from A onto the existing frontier at B, using resources that were unemployed. Another slip is to call A unattainable; A can be produced but leaves resources unemployed, and only points outside the frontier are unattainable.
Related diagrams
Ask Otti about this diagram
Our AI tutor can walk you through every curve, explain exam technique, and quiz you on it.