Prospect Theory (Loss Aversion)
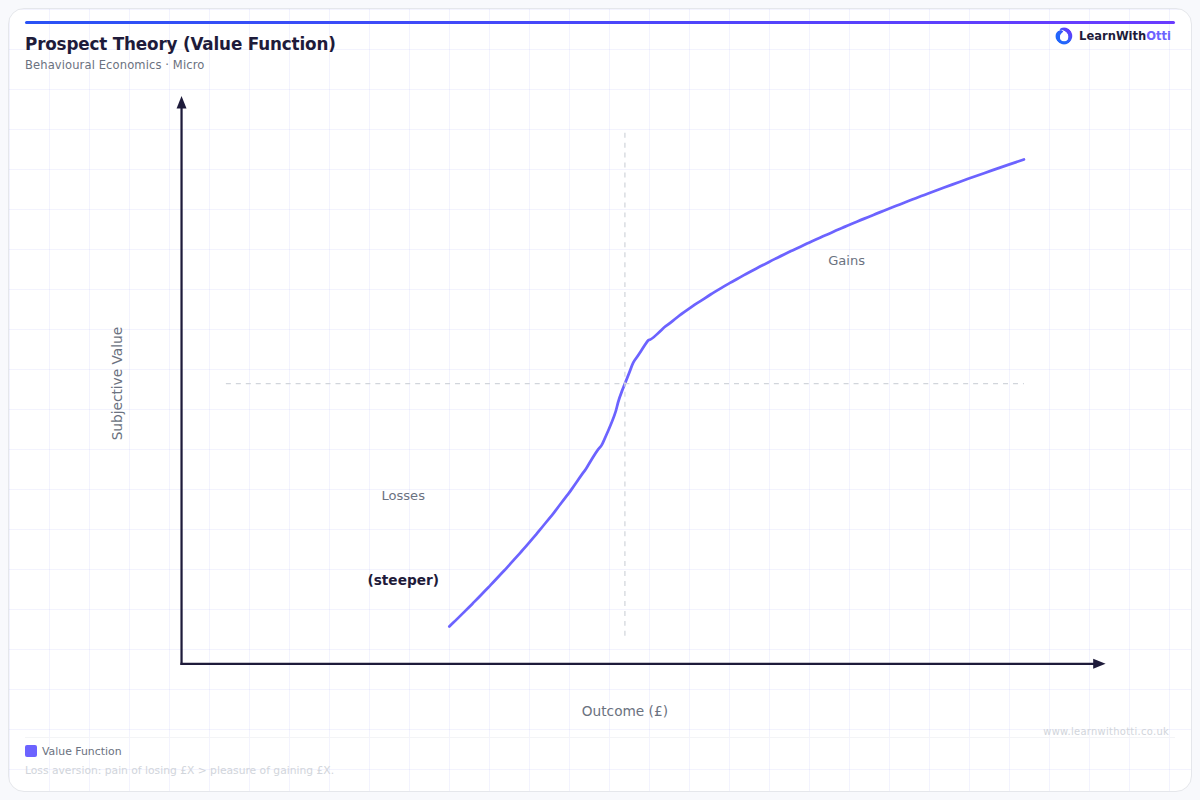
S-shaped value function from Kahneman and Tversky's Prospect Theory showing loss aversion — losses loom larger than equivalent gains in consumers' utility function.
Printable preview
Download a static PNG of this diagram to print or include in revision notes.
Download PNGWhat this diagram shows
Prospect Theory demonstrates that people feel losses more intensely than equivalent gains - a psychological bias called loss aversion. The diagram shows a kinked curve where the negative side (losses) is steeper than the positive side (gains), meaning a £100 loss feels worse than a £100 gain feels good. This matters for understanding market failures because people's irrational behaviour can lead to suboptimal outcomes, particularly in environmental economics where future costs are undervalued. It helps explain why governments need intervention to correct these behavioural biases.
Key points
- The curve is kinked at the origin (reference point) showing how people evaluate gains and losses differently
- Loss aversion means the loss curve is approximately twice as steep as the gain curve
- People are risk-averse in gains (prefer certainty) but risk-seeking in losses (gamble to avoid definite loss)
- This creates market failures as people systematically undervalue future environmental costs
- Explains why carbon taxes are unpopular but carbon credits/subsidies are more acceptable - framing matters
Exam tip
Examiners are impressed when students can explain why the loss curve is steeper than the gain curve using real examples. The most common error is confusing this with a standard demand/supply curve - remember this shows psychological value, not market behaviour.
Common mistakes
Students often draw the curves with equal steepness, missing the key point that losses hurt more than equivalent gains feel good. They also forget to explain how this psychological bias leads to actual market failures requiring government intervention.
Exam board notes
OCR places more emphasis on behavioural economics applications, while AQA focuses more on the policy implications. Edexcel and CIE treat prospect theory as supporting evidence for market failure rather than a central concept.
Related diagrams
Ask Otti about this diagram
Our AI tutor can walk you through every curve, explain exam technique, and quiz you on it.