Trade Union in a Competitive Labour Market
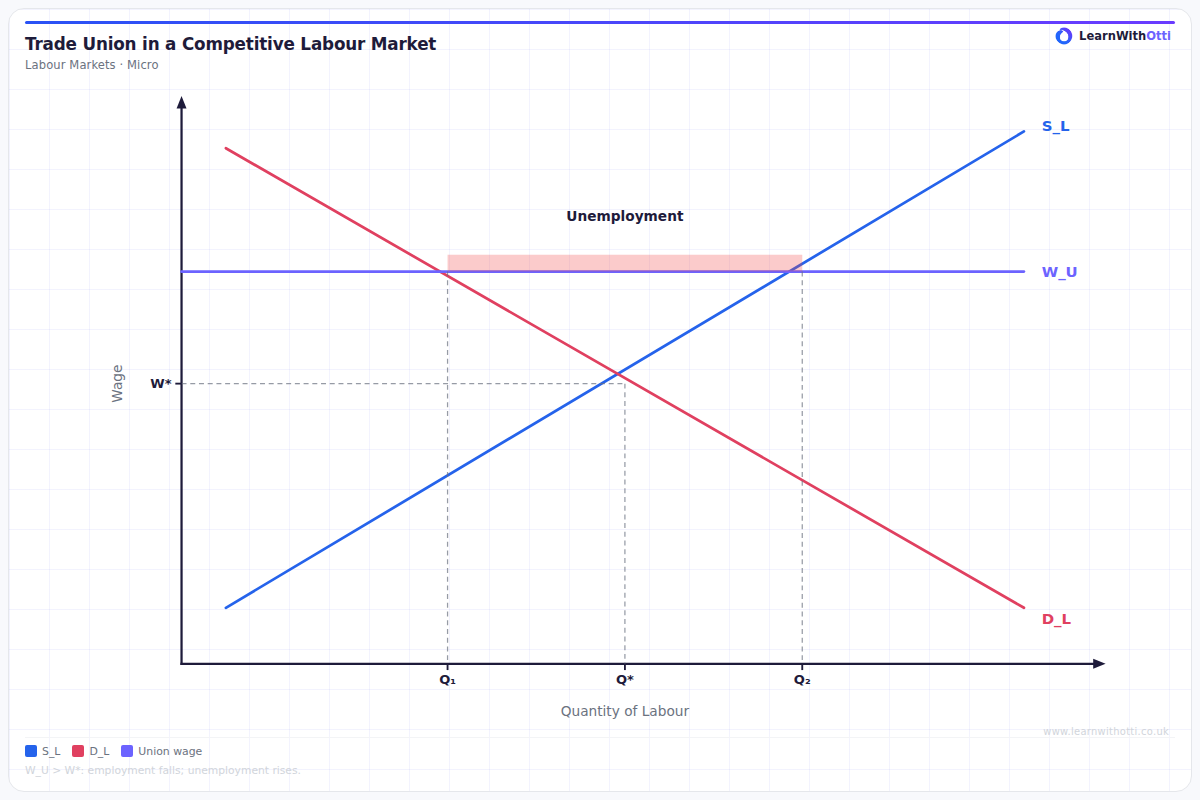
Diagram showing a trade union pushing wages above the competitive equilibrium, creating a wage-employment trade-off with unemployment shown.
Printable preview
Download a static PNG of this diagram to print or include in revision notes.
Download PNGWhat this diagram shows
This diagram shows how trade unions can influence wages in a competitive labour market by acting as monopoly suppliers of labour. When a trade union negotiates wages above the market equilibrium, it creates a horizontal supply curve at the agreed wage level. This results in higher wages for those who remain employed, but also creates unemployment as labour supply exceeds labour demand at the artificially high wage rate. The diagram illustrates the trade-off unions face between securing higher wages for members and potentially reducing employment opportunities.
Key points
- Trade unions can set wages above market equilibrium by acting as monopoly sellers of labour, creating a perfectly elastic supply curve at the union wage rate
- The union wage rate creates excess supply of labour, leading to unemployment as quantity supplied exceeds quantity demanded
- Workers who keep their jobs benefit from higher wages, while some workers become unemployed or excluded from the market
- The resulting unemployment represents allocative inefficiency and creates deadweight loss to society
- The extent of unemployment depends on the wage elasticity of demand for labour - more elastic demand leads to greater job losses
Exam tip
Students often forget to clearly explain WHY unemployment occurs when trade unions set wages above equilibrium - make sure you explicitly state that some workers are willing to work at the higher wage but employers demand fewer workers. Examiners are impressed when you discuss both the benefits to employed members (higher wages) and the costs to society (unemployment and deadweight loss).
Common mistakes
Students frequently confuse cause and effect, incorrectly stating that unemployment causes higher wages rather than higher union wages causing unemployment. Many also fail to distinguish between the original market equilibrium wage and the union-negotiated wage when labelling their diagrams.
Exam board notes
All major exam boards treat this diagram identically, focusing on the same key concepts of union wage-setting, resulting unemployment, and efficiency implications. The core analysis of monopoly union power in competitive markets is consistent across AQA, Edexcel, OCR and CIE specifications.
Related diagrams
Ask Otti about this diagram
Our AI tutor can walk you through every curve, explain exam technique, and quiz you on it.