AD Shift Right — Increase in Aggregate Demand
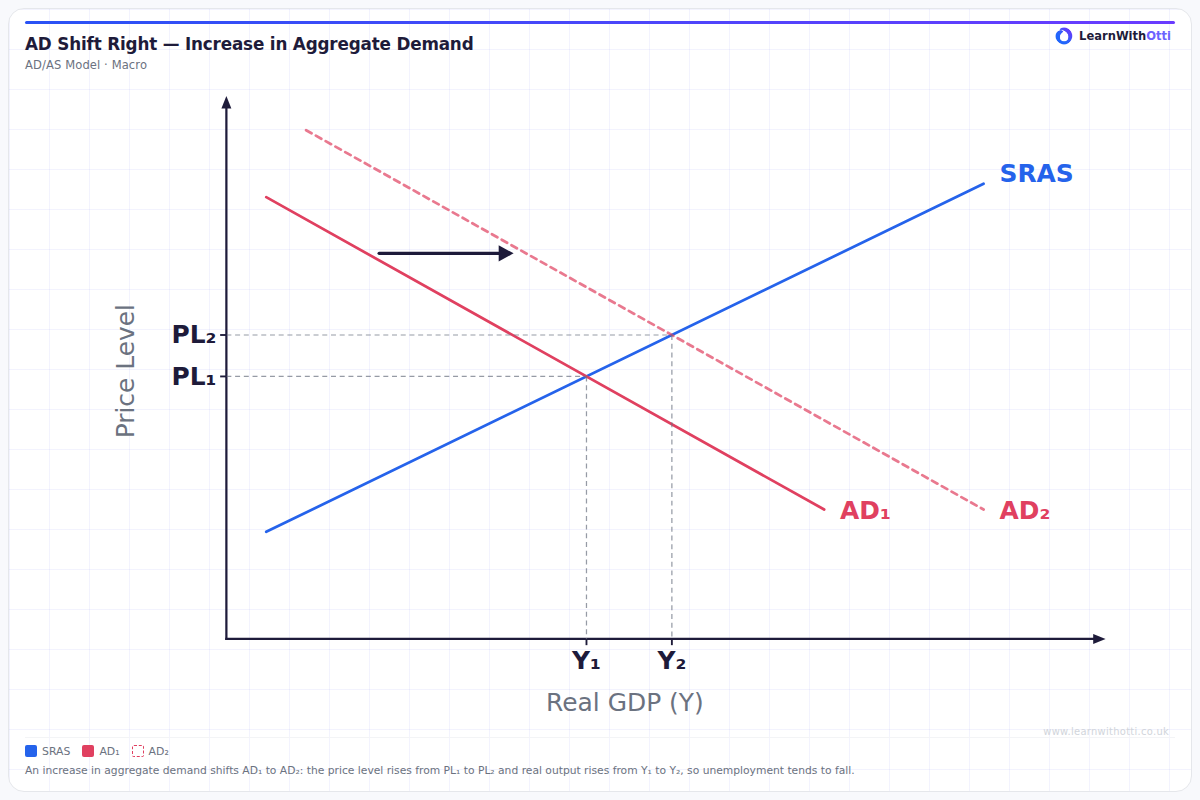
AD/AS diagram with one upward-sloping SRAS: AD₁ shifts right to AD₂ (a parallel shift), so the price level rises from PL₁ to PL₂ and real output rises from Y₁ to Y₂, and unemployment tends to fall.
Printable preview
Download a static PNG of this diagram to print or include in revision notes.
Download PNGWhat this diagram shows
This diagram shows an increase in aggregate demand along a single, upward-sloping SRAS curve. AD shifts right from AD₁ to AD₂, a parallel shift: at every price level, total planned spending on the economy's output is higher. The equilibrium where AD meets SRAS moves up along SRAS, so the price level rises from PL₁ to PL₂ and real output rises from Y₁ to Y₂. The increase in AD could come from higher consumer confidence, a rise in government spending, a cut in interest rates or stronger demand for exports. As firms produce more, they need more workers, so unemployment tends to fall.
Key points
- AD shifts right from AD₁ to AD₂: total planned spending is higher at every price level.
- The price level rises from PL₁ to PL₂: the extra demand pulls prices up, which is demand-pull inflation.
- Real output rises from Y₁ to Y₂, so firms need more workers and unemployment tends to fall.
- SRAS does not shift: the economy moves up along the same SRAS curve, so the change in equilibrium comes entirely from the demand side.
- How much of the increase in AD shows up as a higher price level rather than higher real output depends on how much spare capacity the economy has.
Exam tip
Name both effects and their direction, using the labels on the diagram: AD shifts from AD₁ to AD₂, the price level rises from PL₁ to PL₂ and real output rises from Y₁ to Y₂. Then give a cause of the shift, such as higher consumer confidence, a rise in government spending, a cut in interest rates or stronger demand for exports, and explain that the economy moves along SRAS rather than SRAS shifting.
Common mistakes
Students often say that SRAS shifts as well, or call the move along SRAS an increase in supply. Only AD shifts here; the higher output is a movement along SRAS. Another slip is to give only one effect: an increase in AD along an upward-sloping SRAS raises both the price level (PL₁ to PL₂) and real output (Y₁ to Y₂).
Related diagrams
Ask Otti about this diagram
Our AI tutor can walk you through every curve, explain exam technique, and quiz you on it.