Simultaneous Shifts: Demand Left & Supply Right
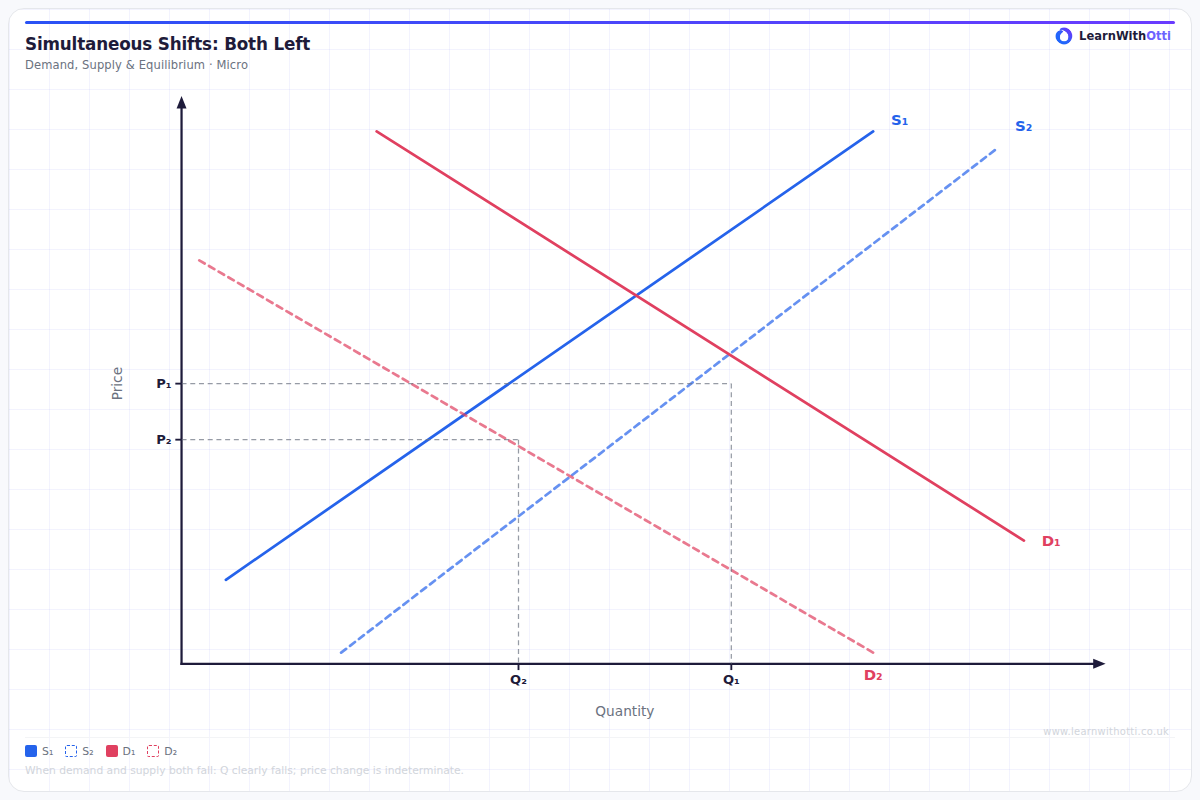
Diagram showing simultaneous leftward shifts of both supply and demand, with the net effect on equilibrium price ambiguous and equilibrium quantity falling.
Printable preview
Download a static PNG of this diagram to print or include in revision notes.
Download PNGWhat this diagram shows
This diagram shows a market where both supply and demand curves shift downward (leftward) simultaneously, creating a new equilibrium point. When supply shifts left, it typically indicates decreased supply due to factors like higher production costs or reduced producer numbers. When demand shifts left, it shows decreased consumer demand due to factors like falling incomes or changing preferences. The combined effect always results in a lower equilibrium quantity, but the price change depends on which curve shifts more significantly.
Key points
- Both supply and demand curves shift leftward (downward), indicating decreases in both supply and demand
- Equilibrium quantity will definitely fall as both shifts work in the same direction to reduce quantity
- The effect on equilibrium price is indeterminate - it depends on the relative magnitude of each shift
- If demand decreases more than supply, price will fall; if supply decreases more than demand, price will rise
- Common causes include economic recession (affecting demand) combined with supply-side shocks like increased input costs
Exam tip
When both curves shift down (leftward), always identify the specific causes for each shift separately before analysing the combined effect. Examiners are impressed when students clearly explain that while quantity definitely decreases, the price effect is indeterminate without knowing the relative magnitudes of the shifts.
Common mistakes
Students often assume that because both curves shift 'down', the price must fall, forgetting that leftward supply shifts actually increase price pressure. They also frequently fail to explain that the price outcome depends on which shift is larger in magnitude.
Exam board notes
All major exam boards treat this diagram identically, expecting students to analyse both shifts separately and then combine the effects. The emphasis on explaining indeterminate outcomes is consistent across AQA, Edexcel, OCR and CIE specifications.
Related diagrams
Ask Otti about this diagram
Our AI tutor can walk you through every curve, explain exam technique, and quiz you on it.