Keynesian AS Curve Shift Left (Decrease in Productive Potential)
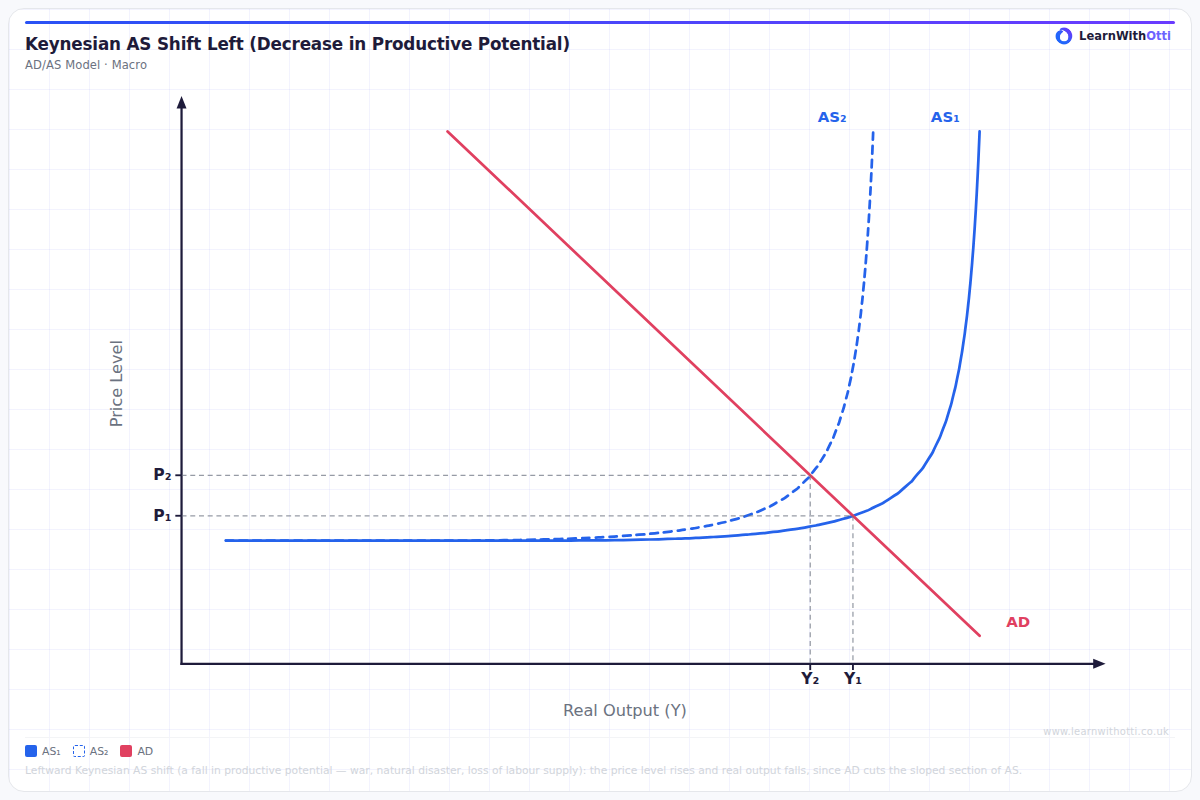
Keynesian AD/AS diagram showing the Keynesian AS curve shifting left due to a decrease in productive potential, raising the price level and reducing real output where AD cuts the sloped section.
Printable preview
Download a static PNG of this diagram to print or include in revision notes.
Download PNGWhat this diagram shows
The Keynesian AS curve has a distinctive three-stage shape: a flat section when the economy has spare capacity, an upward-sloping section as resources become scarcer, and a vertical section at full employment. When this curve shifts to the left, it means the economy's maximum productive potential has fallen — the same price levels now correspond to lower levels of real output at every point. This matters because it signals a permanent deterioration in the economy's supply-side performance, potentially causing stagflation (rising prices and falling output) if AD remains unchanged.
Key points
- A leftward shift of the Keynesian AS curve represents a decrease in productive potential, meaning the economy can produce less real output at every price level.
- Common causes include a reduction in the quantity or quality of factors of production — for example, net emigration reducing the labour force, destruction of capital stock, or depletion of natural resources.
- If AD remains constant, a leftward AS shift will push the equilibrium price level up and real output down, creating stagflationary conditions — a combination that is very difficult for policymakers to address.
- The vertical section of the Keynesian AS curve (representing full employment/full capacity) moves to the left, indicating a lower ceiling on what the economy can produce even under the most favourable demand conditions.
- Supply-side policies (e.g., investment in education and training, infrastructure spending) are the appropriate policy response, as expansionary demand-side policies would worsen inflation without restoring lost output capacity.
Exam tip
Students often confuse a leftward shift of the Keynesian AS curve with a movement along it — examiners want you to be explicit that a shift represents a change in productive potential, not a change in the price level. To impress examiners, link the shift to a specific supply-side factor (e.g., net emigration reducing the labour force) and evaluate the long-run consequences for both inflation and real output simultaneously.
Common mistakes
A very common error is confusing a shift of the AS curve with a movement along it — real output changes along an unchanged AS curve when AD shifts, whereas only a change in supply-side conditions moves the curve itself. Students should also distinguish a rise in production costs, which pushes the curve upwards but leaves the full-capacity ceiling where it is, from a genuine loss of productive potential, which moves that vertical section leftwards and lowers the maximum output the economy can reach.
Exam board notes
AQA and Edexcel both use the Keynesian AS curve and expect students to analyse leftward shifts in the context of supply-side deterioration and the risk of stagflation. Edexcel typically asks students to evaluate an appropriate policy response, while AQA places more weight on correctly identifying the specific cause of the shift.
Related diagrams
Ask Otti about this diagram
Our AI tutor can walk you through every curve, explain exam technique, and quiz you on it.