Supply-Side Policy and LRAS
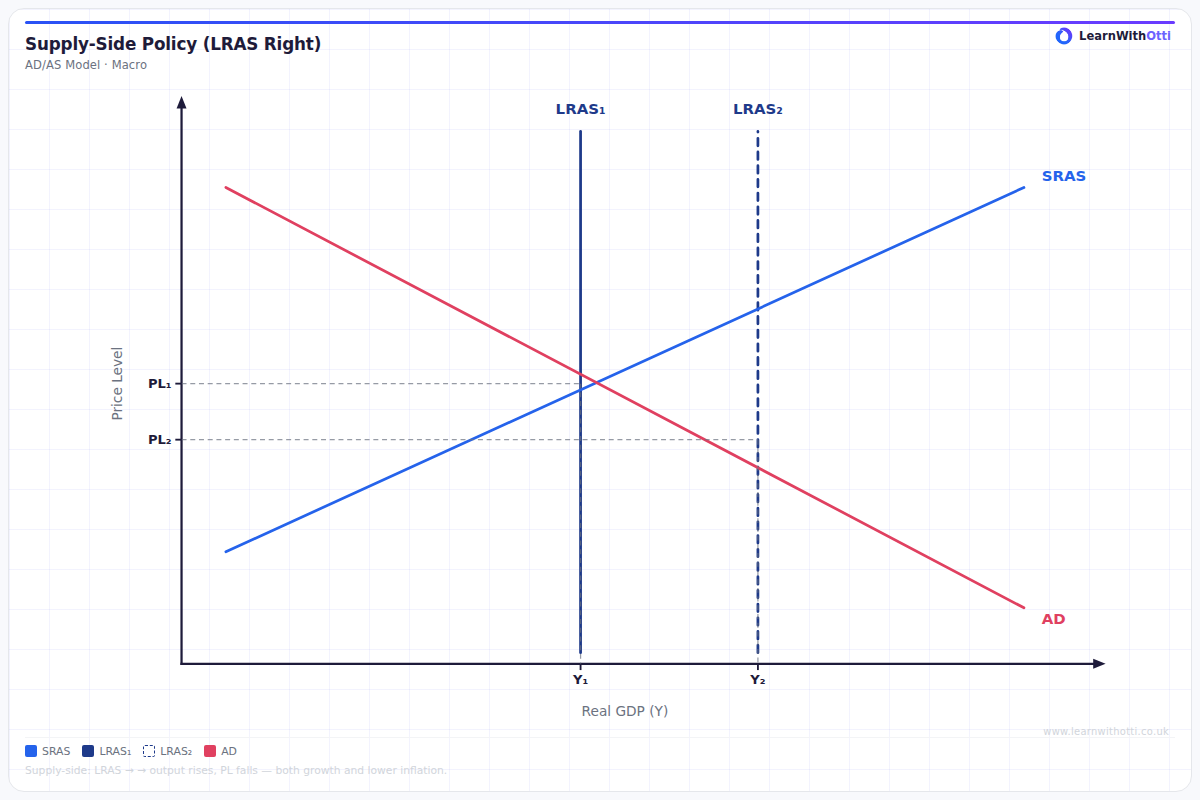
Diagram showing how supply-side policies (education, deregulation, tax reform, infrastructure) shift the LRAS rightward, raising the economy's potential output.
Printable preview
Download a static PNG of this diagram to print or include in revision notes.
Download PNGWhat this diagram shows
This diagram illustrates how supply-side policies shift the Long Run Aggregate Supply (LRAS) curve to the right, demonstrating an increase in an economy's productive potential. Supply-side policies aim to improve the economy's ability to produce goods and services by enhancing the quantity and quality of factors of production. The rightward shift shows that the economy can now produce more output at every price level, leading to sustainable economic growth without inflationary pressure. This is crucial for understanding how governments can achieve long-term improvements in economic performance.
Key points
- Supply-side policies shift LRAS right by increasing the economy's productive capacity and potential output
- The shift results in higher real GDP and lower price levels, achieving the ideal combination of growth with reduced inflation
- Examples include education and training (improving labour quality), infrastructure investment, deregulation, and tax reforms
- Unlike demand-side policies, supply-side policies create sustainable long-term growth without creating inflationary pressure
- The effectiveness depends on the time lag - supply-side policies typically take years to show full impact on productive capacity
Exam tip
Always explain the transmission mechanism clearly - don't just say 'supply-side policies shift LRAS right'. Examiners are impressed when you explain HOW these policies improve productive capacity through factors like increased labour productivity, enhanced competition, or better resource allocation.
Common mistakes
Students often confuse this with short-run supply changes and draw SRAS shifting instead of LRAS. They also frequently forget to explain that the economy moves to a new long-run equilibrium with permanently higher output, not just a temporary change.
Exam board notes
All major exam boards treat this diagram identically, though Edexcel sometimes places greater emphasis on evaluating the time lags and practical limitations of supply-side policies in essay questions.
Related diagrams
Ask Otti about this diagram
Our AI tutor can walk you through every curve, explain exam technique, and quiz you on it.