Losses: Perfect and Imperfect Competition
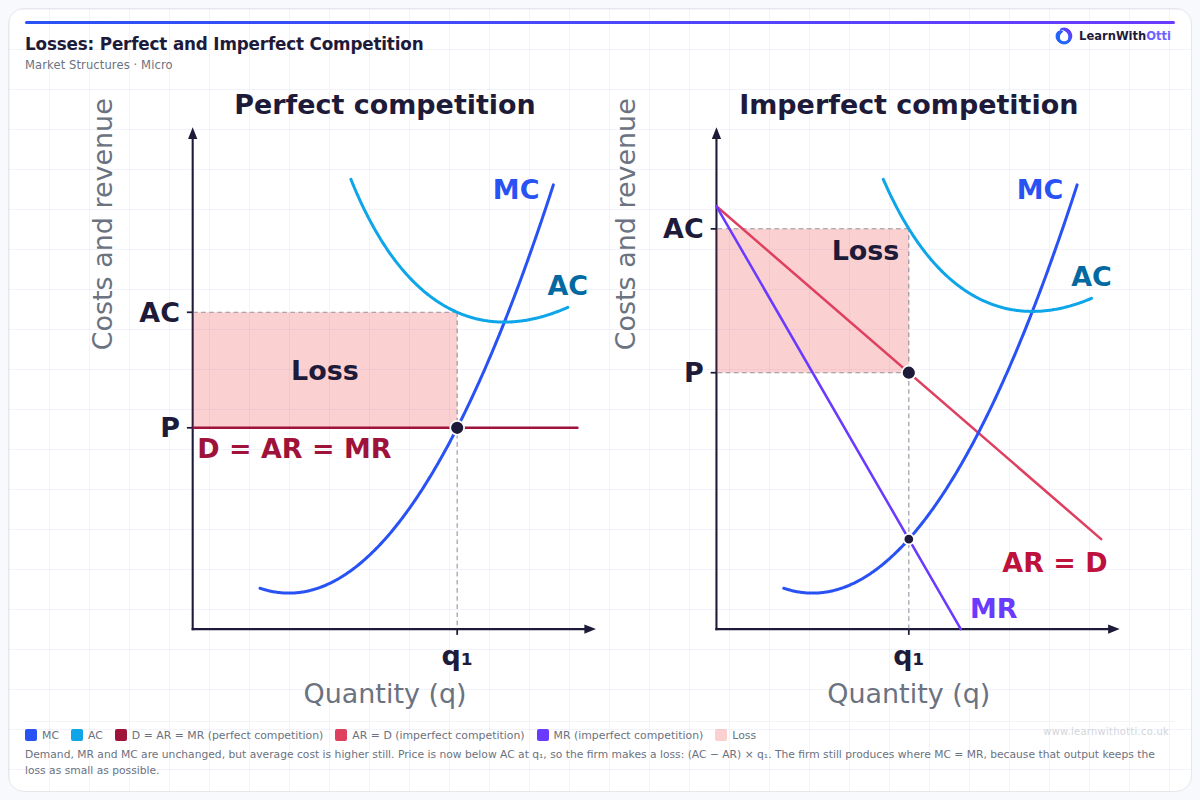
Two-panel diagram comparing a loss-making perfectly competitive firm (left) and imperfectly competitive firm (right), with the same MC and AC curves. Both produce q₁ where MC = MR on the rising MC, and price is read from the demand (AR) curve. AR is below AC at q₁, so the firm makes a loss, shaded as (AC − AR) × q₁; producing where MC = MR keeps that loss as small as possible.
Printable preview
Download a static PNG of this diagram to print or include in revision notes.
Download PNGWhat this diagram shows
Demand, MR and MC are the same as in the supernormal and normal profit diagrams, but fixed costs are higher still, so AC sits higher at every output. Because fixed costs do not affect MC, both firms still produce q₁ where MC = MR on the rising part of MC and read the same price from their demand (AR) curve. Now AR is below AC at q₁, so total revenue does not cover total cost and the firm makes a loss, shown by the shaded rectangle (AC − AR) × q₁. Producing where MC = MR keeps that loss as small as possible.
Key points
- Both firms produce where MC = MR, at q₁ on the rising part of MC. Here that rule minimises the loss rather than maximising a profit.
- The price is read from the AR curve above q₁: horizontal for the price taker, downward sloping for the imperfectly competitive firm.
- A loss occurs when AR is below AC at q₁, so total revenue is less than total cost.
- Loss = (AC − AR) × q₁: the loss per unit, AC − AR, multiplied by output.
- Higher fixed costs raise AC but leave MC, q₁ and the price unchanged: the same firm moves from supernormal profit to normal profit to a loss.
Exam tip
Mark q₁ where MC = MR on the rising part of MC, read the price from AR above q₁, then read AC at the same output. The loss is the rectangle (AC − AR) × q₁, between AC and the price out to q₁. Show that the same MC = MR rule applies in both market structures.
Common mistakes
Assuming that a firm with a downward-sloping demand curve always makes supernormal profit: if AC is high enough to lie above AR, it makes a loss. Students also cut output when fixed costs rise, but fixed costs do not change MC, so the loss-minimising output stays at q₁.
Related diagrams
Supernormal Profit: Perfect and Imperfect Competition
View →Market StructuresNormal Profit: Perfect and Imperfect Competition
View →Market StructuresProfit Maximisation (MR = MC)
View →Market StructuresPerfect Competition: Short-Run Supernormal Profit
View →Market StructuresMonopoly — Profit Maximisation
View →Ask Otti about this diagram
Our AI tutor can walk you through every curve, explain exam technique, and quiz you on it.