Regulated Monopoly — Maximum Price (Price Cap)
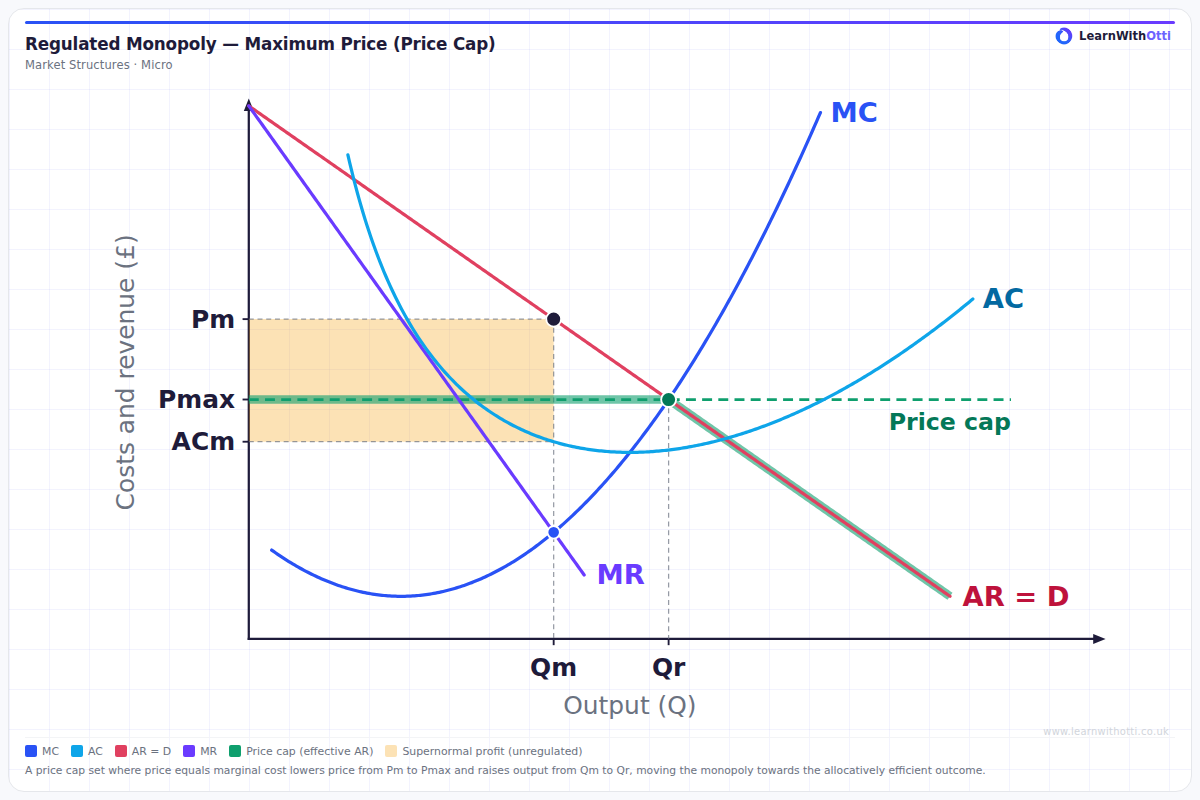
Monopoly with AR = 100 − Q and MR = 100 − 2Q, and cubic costs giving a U-shaped MC (minimum £8 at Q = 20) and a U-shaped AC (minimum £35 at Q = 50, where MC cuts it). Unregulated, MR = MC gives Qm = 40 and Pm = 60 with supernormal profit. A price cap of Pmax ≈ £44.92, set where price equals marginal cost, makes the effective AR flat at Pmax up to Qr ≈ 55.08, so output rises and the firm still covers its average cost.
Printable preview
Download a static PNG of this diagram to print or include in revision notes.
Download PNGWhat this diagram shows
This diagram shows a monopoly with AR = D given by P = 100 − Q and MR = 100 − 2Q. Its total cost is TC = 1000 + 20Q − 0.6Q² + 0.01Q³, so MC = 20 − 1.2Q + 0.03Q² and AC = 1000/Q + 20 − 0.6Q + 0.01Q². MC falls to a minimum of £8 at Q = 20 and then rises steeply, and AC is U-shaped with its minimum of £35 at Q = 50, where MC cuts it. Unregulated, the firm produces where MR = MC, at Qm = 40, and charges Pm = 60, read off the AR curve. Average cost there is ACm = £37, so the shaded rectangle (Pm − ACm) × Qm is supernormal profit. A regulator then sets a price cap (a maximum price) of Pmax ≈ £44.92, where price equals marginal cost. The firm cannot charge more than Pmax, so its effective AR is flat at Pmax up to Qr ≈ 55.08 and then follows the original AR. Output rises to Qr and price falls to Pmax, moving the monopoly towards the allocatively efficient outcome where P = MC.
Key points
- Unregulated: MR = MC at Qm = 40, on the rising part of MC, and the price read off AR = D is Pm = 60.
- At Qm, average cost is ACm = £37, so the shaded area (Pm − ACm) × Qm = £920 is supernormal profit.
- MC cuts AC at AC's minimum: AC is lowest at Q = 50, where AC = MC = £35. To the left of that point MC is below AC and pulls it down; to the right MC is above AC and pulls it up.
- The price cap Pmax ≈ £44.92 is set where price equals marginal cost: AR meets the rising MC at Qr ≈ 55.08.
- With the cap, the effective AR is horizontal at Pmax up to Qr and then follows the original AR, so output rises from Qm = 40 to Qr ≈ 55.08 and price falls from Pm = 60 to Pmax ≈ £44.92.
- At Qr, average cost is about £35.45, below the cap, so the firm still covers its costs and stays in the market, with a smaller supernormal profit of about £522; a cap set below average cost would leave the firm making a loss.
Exam tip
Use the numbers on the diagram to show both effects. Without regulation the monopoly produces where MR = MC, at Qm = 40, on the rising part of MC, and charges Pm = 60. A price cap of Pmax ≈ £44.92, set where price equals marginal cost, makes the firm's effective AR flat at Pmax up to Qr ≈ 55.08, so each extra unit up to Qr adds Pmax to revenue and the firm expands output to Qr. Then check that the firm still covers its costs: average cost at Qr is about £35.45, below the cap, so it stays in the market.
Common mistakes
Students often show a price cap cutting output, as a maximum price does in a competitive market. For a monopoly, a cap at Pmax makes the effective AR flat at that price up to Qr, so marginal revenue equals Pmax over that range and the firm expands output from Qm to Qr. Another slip is to ignore the effective AR beyond Qr: past Qr the firm faces the original AR = D again, so it would have to cut its price below the cap to sell more. When drawing the cost curves, make MC cut AC at AC's lowest point, not to one side of it.
Related diagrams
Ask Otti about this diagram
Our AI tutor can walk you through every curve, explain exam technique, and quiz you on it.