Progressive, Proportional and Regressive Taxes
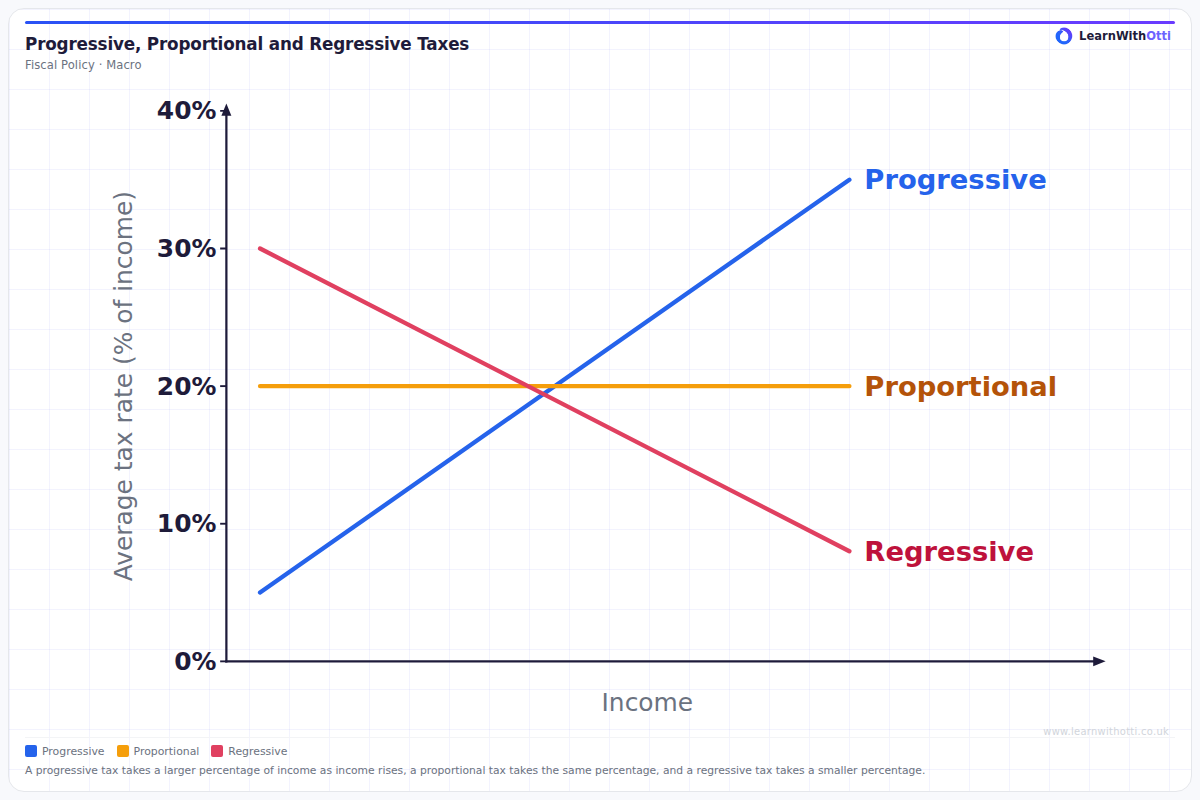
Schematic of the average tax rate against income for three taxes: a progressive tax whose average rate rises with income, a proportional tax with the same average rate at every income, and a regressive tax whose average rate falls as income rises.
Printable preview
Download a static PNG of this diagram to print or include in revision notes.
Download PNGWhat this diagram shows
This schematic diagram shows the average tax rate (% of income) against income for three types of tax, drawn over the same range of income. The progressive line rises from left to right: the tax takes a larger percentage of income as income rises. The proportional line is flat: the tax takes the same percentage of income at every income. The regressive line falls: the tax takes a smaller percentage of income as income rises. The lines differ only in how the average rate changes with income.
Key points
- Progressive tax: the average tax rate rises as income rises, so higher earners pay a larger percentage of their income in tax.
- Proportional tax: the average tax rate is the same at every income, so its line is flat.
- Regressive tax: the average tax rate falls as income rises, so lower earners pay a larger percentage of their income in tax.
- The average tax rate is tax paid ÷ income × 100. The diagram compares percentages of income, not the amount of tax paid in pounds.
- A progressive tax tends to reduce income inequality after tax, while a regressive tax tends to widen it.
Exam tip
Read the vertical axis: it shows the average tax rate, tax paid as a percentage of income, not the amount of tax paid. A regressive tax can still take more pounds from a high earner than from a low earner; what makes it regressive is that the percentage of income it takes falls as income rises. Check any example against that definition: UK income tax, with higher rates on higher bands of income, is progressive, while VAT is usually described as regressive because lower-income households spend a larger share of their income.
Common mistakes
Students often call a tax regressive because richer people pay more of it, or progressive because they pay more in pounds. The test is the average rate: a tax is regressive when the percentage of income paid falls as income rises, even if richer people still pay more in total. Another slip is to judge a tax only by its marginal rate on the last pound earned; the lines on this diagram show the average rate on all income.
Related diagrams
Ask Otti about this diagram
Our AI tutor can walk you through every curve, explain exam technique, and quiz you on it.