AQA A-Level Economics · Revision notes
4.1.1.5 Production Possibility Diagrams
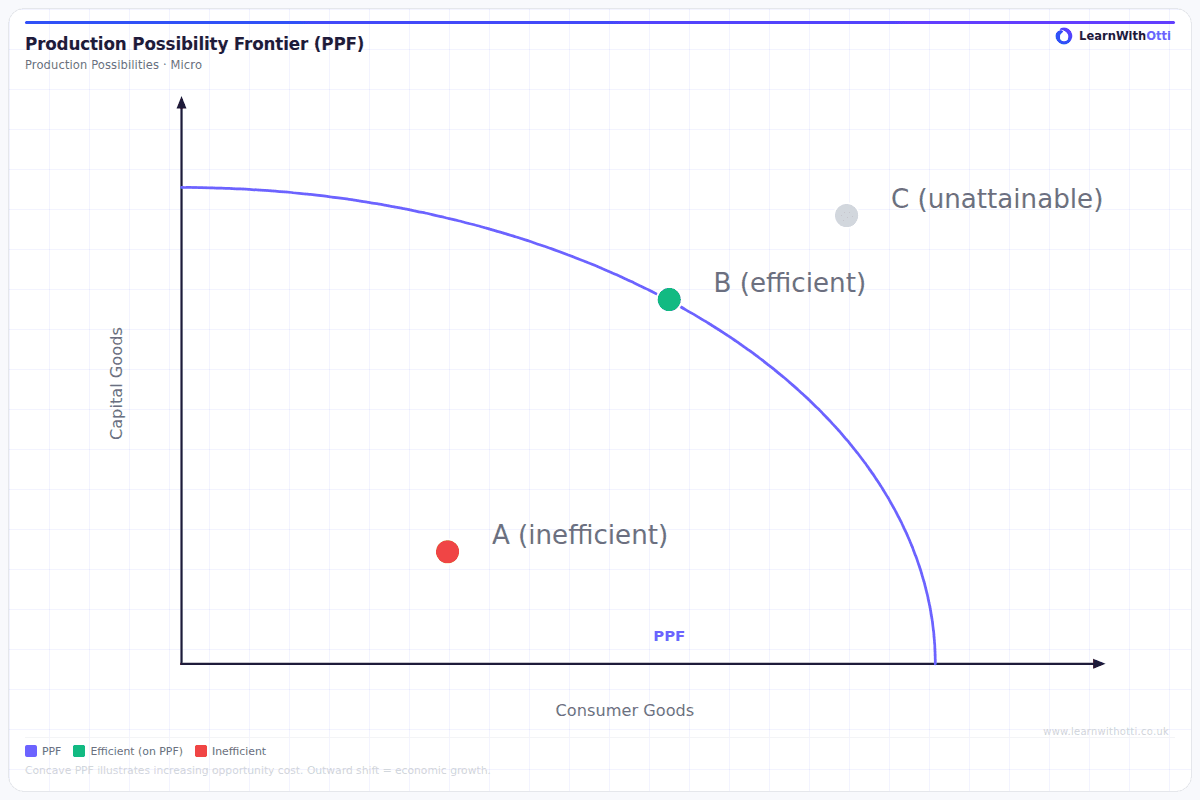
A production possibility diagram shows all the combinations of two goods an economy can produce when it uses all its resources efficiently. The boundary is called the production possibility boundary or frontier. It is a simple diagram that illustrates almost every feature of the fundamental economic problem.
The production possibility boundary
Each axis measures the quantity of one good. The boundary shows the maximum output combinations achievable with the economy's current resources and technology.
- Points on the boundary are achievable and use all resources efficiently.
- Points inside the boundary are achievable but leave some resources unused or poorly used.
- Points outside the boundary are not achievable with current resources and technology.
What the diagram illustrates
Resource allocation Each point on the boundary represents a different way of allocating the economy's resources between the two goods. Moving along the boundary means reallocating resources from one good to the other.
Opportunity cost and trade-offs Because resources are fully used on the boundary, producing more of one good requires producing less of the other. The amount of the other good given up is the opportunity cost.
The boundary is usually drawn bowed outwards (concave to the origin). This shows increasing opportunity cost: resources are not equally suited to producing both goods, so as more of one good is produced, the economy must use resources that are less and less suited to it, and each extra unit costs more of the other good. If resources were equally suited to both, the boundary would be a straight line with constant opportunity cost.
Opportunity cost of one more unit of X = units of Y given up / extra units of X gained
Worked example An economy produces cars and wheat. At point A it makes 100 cars and 300 tonnes of wheat. To reach point B, 120 cars, it must move resources out of farming, and wheat output falls to 270 tonnes.
- Cars gained: 120 − 100 = 20
- Wheat given up: 300 − 270 = 30 tonnes
- Opportunity cost of each extra car: 30 / 20 = 1.5 tonnes of wheat
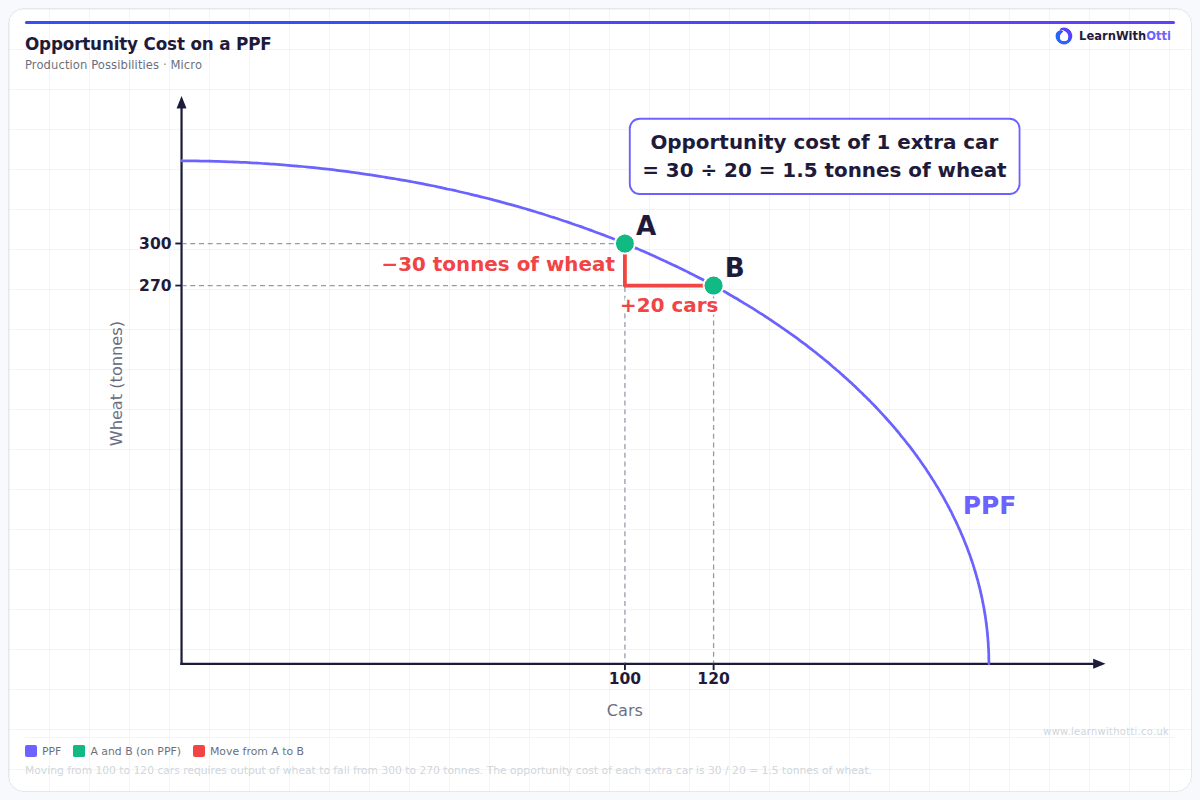
The figure of 1.5 is the average cost per car over the move from A to B. Because the boundary is curved, the cost is different elsewhere on it.
Reading further along the same frontier shows the cost rising:
| Move | Extra cars | Wheat given up (approx.) | Cost per extra car (approx.) |
|---|---|---|---|
| 80 → 100 cars | 20 | 22 tonnes | 1.1 tonnes |
| 100 → 120 cars | 20 | 30 tonnes | 1.5 tonnes |
| 120 → 140 cars | 20 | 40 tonnes | 2.0 tonnes |
Each block of 20 extra cars costs more wheat than the last. This is increasing opportunity cost in numbers.
Trade-offs between the present and the future The same logic applies to choosing between consumer goods, enjoyed now, and capital goods, such as machinery and infrastructure, which raise future output. Producing more capital goods today means consuming less today, but it shifts the boundary further outwards in future.
Unemployment of economic resources A point inside the boundary shows that the economy is not using all its resources. This might happen in a recession, when workers are unemployed and factories are underused.
Watch out: Moving from inside the boundary to a point on it uses existing resources more fully, with no opportunity cost.
Economic growth An outward shift of the boundary shows an increase in the economy's productive potential. This can be caused by:
- more resources, such as a larger workforce;
- better quality resources, such as a more skilled workforce;
- improved technology;
- investment in capital.
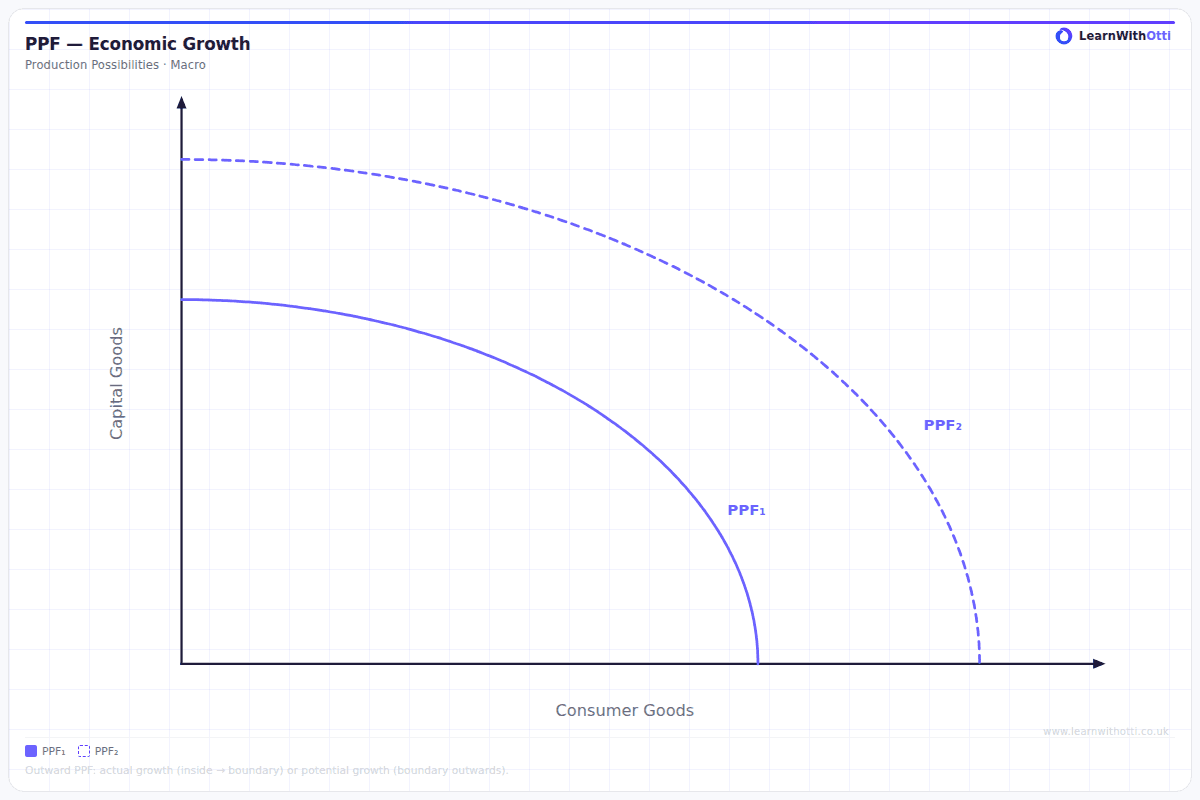
If the improvement affects only one good, such as a new technology used only in making cars, the boundary pivots outwards along that good's axis only.
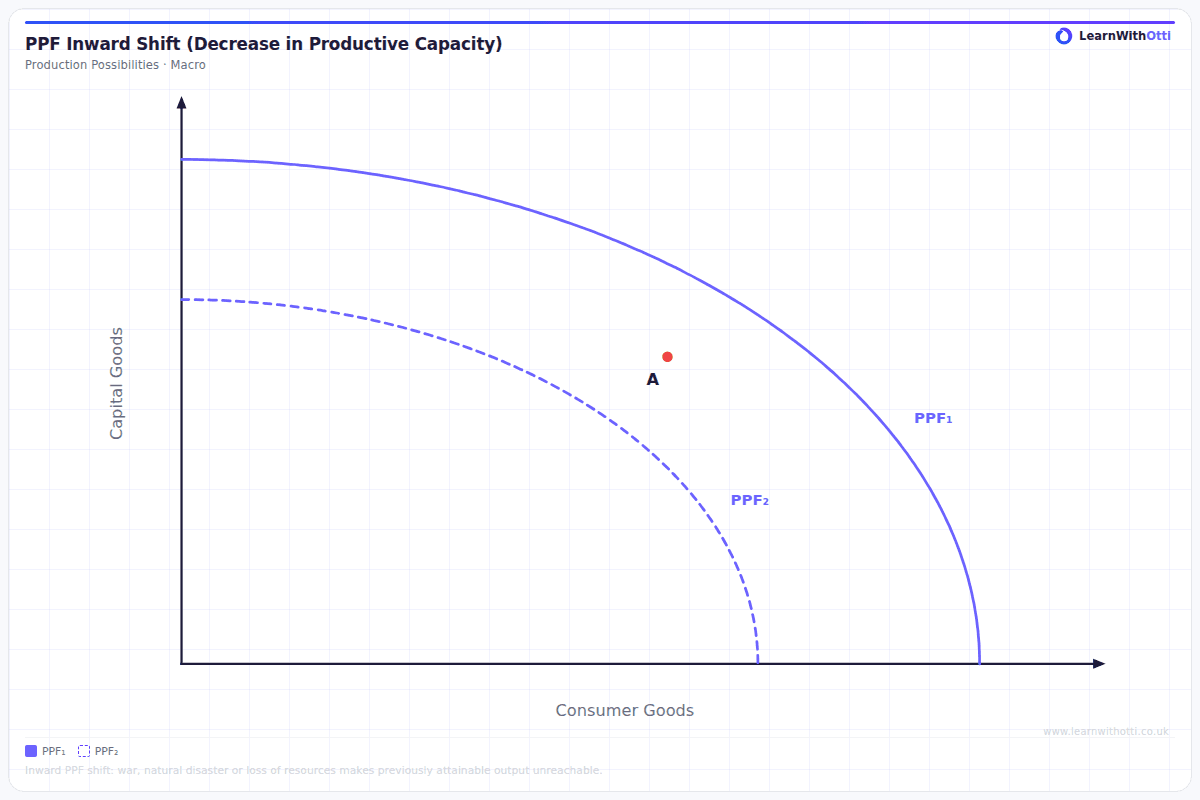
An inward shift shows a fall in productive potential, for example after a natural disaster or a war, or as natural resources are depleted.
Productive efficiency and allocative efficiency
All points on the boundary are productively efficient. Productive efficiency means producing the maximum output from the available resources, so that no more of one good can be produced without producing less of another. Every point on the boundary meets this condition.
Key distinction: Not all points on the boundary are allocatively efficient. Allocative efficiency means producing the combination of goods that best matches what consumers want, so that society's welfare is maximised. Of all the productively efficient points on the boundary, only one combination best reflects consumers' preferences.
For example, an economy could efficiently produce nothing but military equipment and almost no food. That point would be on the boundary, so productively efficient, but it would be far from allocatively efficient because it does not reflect what people want.
Key terms
| Term | Meaning |
|---|---|
| Production possibility boundary | The maximum combinations of two goods an economy can produce with its resources and technology |
| Opportunity cost | The amount of one good given up to produce more of another |
| Increasing opportunity cost | Each additional unit of a good costs more of the other good |
| Productive efficiency | Producing the maximum output from given resources |
| Allocative efficiency | Producing the combination of goods that best reflects consumers' preferences |
| Capital goods | Goods used to produce other goods, such as machinery and infrastructure |
| Economic growth | An outward shift of the boundary, showing an increase in productive potential |
Common mistakes
- Giving the total instead of the cost per unit. Losing 30 tonnes is the total cost of 20 cars; the cost per car is 1.5 tonnes.
- Treating every point on the boundary as allocatively efficient. All are productively efficient; only one is allocatively efficient.
- Calling a move from inside to the boundary economic growth. That is using existing capacity; growth in potential is an outward shift.
- Calculating opportunity cost the wrong way up. The cost of one more car is the wheat given up divided by the extra cars gained; 20 / 30 would instead give the cost of a tonne of wheat in cars.
- Shifting the whole boundary for a change affecting one good. An improvement in technology for one good pivots the boundary along that good's axis only.
How this has been examined
In the AQA papers indexed on this site, this topic has appeared in two formats:
- 1-mark multiple choice — asked 5 times across 5 series (2018 to 2025)
- 15-mark "Explain" essay — asked once (2020)
Where this goes next
The diagram turns the ideas in 4.1.1.4 Scarcity, choice and the allocation of resources into a picture. Specialisation, which allows output beyond what each producer could achieve alone, is covered in 4.1.4.2 Specialisation, division of labour and exchange, and is developed between countries in 4.2.6.2 Trade. Long-run growth as an outward shift reappears in 4.2.3.1 Economic growth and the economic cycle, and the two types of efficiency are compared across market structures in 4.1.5.10 Market structure, static efficiency, dynamic efficiency and resource allocation.
End of topic 4.1.1
Quiz yourself on 4.1.1 Economic methodology and the economic problem
10 multiple-choice questions drawn from the 27 we have on the whole of topic 4.1.1, with instant feedback on every answer.
Start the 4.1.1 quiz →Otti is an AI tutor built for A-Level students. Ask it anything, practise exam questions, and get instant feedback written like an examiner would give it — not just right or wrong, but why.
Get one answer marked free