AQA A-Level Economics · Revision notes
4.2.2.4 Aggregate Demand and the Level of Economic Activity
Changes in aggregate demand (AD) are a major influence on the level of economic activity, and when an injection into the circular flow changes, national income changes by more than the original amount. The reason is simple: one person's spending is another person's income, and part of that income is spent again. This topic covers the role of AD in influencing output and employment, the multiplier process, the marginal propensity to consume (MPC), how to use the MPC to calculate the multiplier, and why the size of the MPC determines the size of the multiplier effect.
The multiplier ratio
The multiplier ratio compares the final change in real national income with the initial change in injections that caused it.
multiplier = final change in real national income ÷ initial change in injections
If the government spends an extra £10bn on new railway lines and real national income eventually rises by £25bn, the multiplier is 25 ÷ 10 = 2.5.
The multiplier works in both directions. A fall in an injection, such as a drop in exports, or a rise in a withdrawal, such as households choosing to save more, reduces national income by more than the initial change. This is sometimes called the negative multiplier.
The multiplier process
The process happens in rounds.
Round 1: the injection. The government spends £10bn on new railway lines. That £10bn becomes income for construction firms and their workers.
Round 2: induced spending. The firms and workers do not spend all of their extra income on domestic output. Some is saved, some is taken in tax and some is spent on imports. Suppose 60% is passed on as spending on UK goods and services. That is £6bn of extra spending, which becomes income for shop owners, restaurant staff and their suppliers.
Round 3 and beyond. Those people in turn pass on 60% of their extra income, adding £3.6bn, then £2.16bn, and so on. Each round is smaller than the last, because some income leaks out of the circular flow at every stage.
Adding up every round, 10 + 6 + 3.6 + 2.16 + ... gets closer and closer to £25bn. The initial £10bn injection has raised national income by £25bn, a multiplier of 2.5.
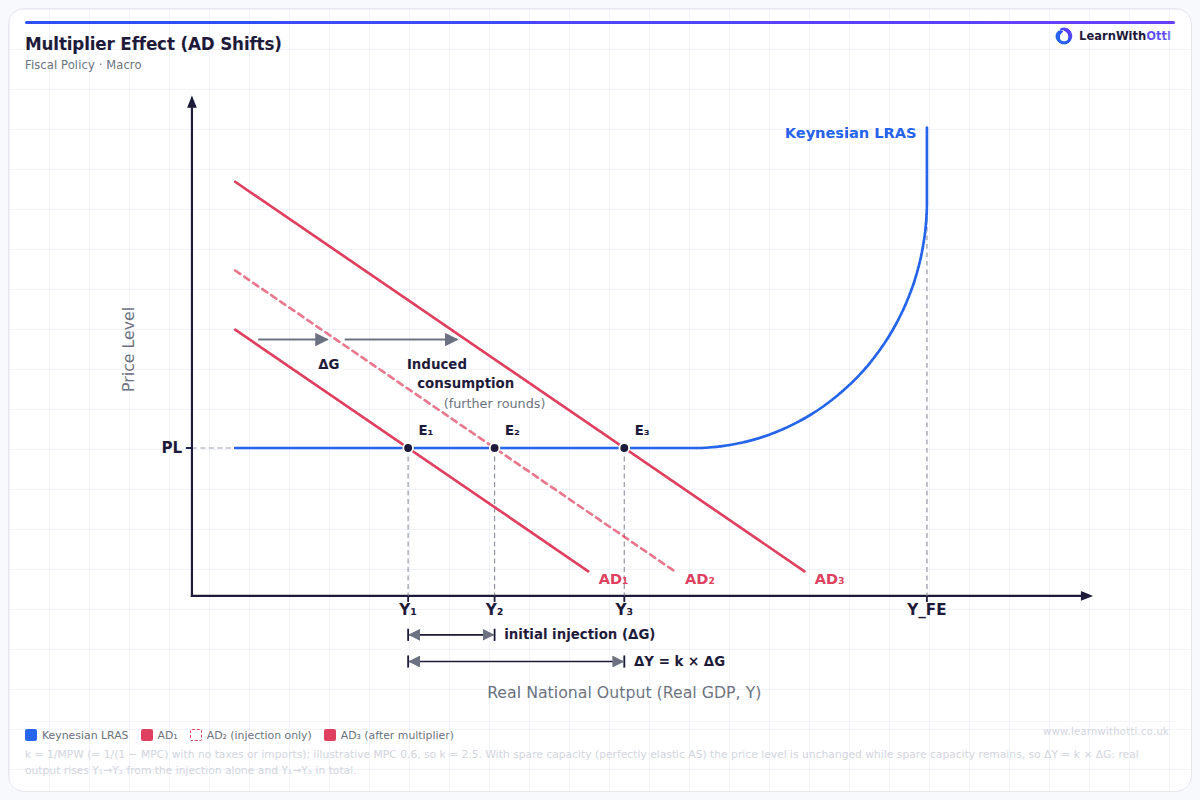
The diagram separates the two parts of the shift in AD. The first shift is the injection itself. The second, larger shift is the induced consumption that follows as the extra income is spent again.
Local and national multipliers
The same process works at the level of a town or region. If a new factory opens in an area, the wages it pays are spent in local shops and services, raising other local incomes. The local multiplier is smaller when more of the extra income is spent outside the area, just as the national multiplier is smaller when more is spent on imports.
Marginal propensities
A marginal propensity is the proportion of an extra pound of income that is used in a particular way. Marginal means "of the next unit", so these measure what happens to additional income, not to total income.
- Marginal propensity to consume (MPC). The proportion of extra income spent on consumption. If income rises by £100 and spending on domestic output rises by £80, the MPC is 80 ÷ 100 = 0.8, or 80%.
- Marginal propensity to save (MPS). The proportion of extra income saved.
- Marginal propensity to tax (MPT). The proportion of extra income taken in tax, such as income tax, National Insurance and VAT on extra purchases.
- Marginal propensity to import (MPM). The proportion of extra income spent on goods and services produced abroad.
The three withdrawals add up to the marginal propensity to withdraw (MPW):
MPW = MPS + MPT + MPM
Key idea: In the multiplier model, every extra pound is either passed on as spending on domestic output or withdrawn from the circular flow. So MPC + MPW = 1.
If the MPW is 0.4, the MPC is 0.6.
How the propensities affect the multiplier
- A higher MPC means a larger multiplier. More of each round of income is passed on, so the later rounds are bigger.
- A higher MPS, MPT or MPM means a smaller multiplier. More income leaks out at each stage, so the process dies away faster.
Evaluation: This is why the multiplier is smaller in an open economy such as the UK than in simple textbook examples. A large share of extra spending goes on imports, and income tax and National Insurance take a share of every extra pound earned.
Calculating the multiplier
multiplier = 1 ÷ (1 − MPC)
Worked example 1: using the MPC. The MPC is 0.75. multiplier = 1 ÷ (1 − 0.75) = 1 ÷ 0.25 = 4
Worked example 2: using the multiplier. The multiplier is 2 and investment rises by £15bn. Final change in national income = 2 × £15bn = £30bn
Working backwards: if the government wants national income to rise by £40bn and the multiplier is 2.5, the injection needed is £40bn ÷ 2.5 = £16bn.
Effects of the multiplier on the economy
- Policy has a bigger effect. A rise in Government Expenditure raises national income by more than the amount spent, so a smaller injection can be used to reduce a negative output gap.
- Employment rises. As output rises through successive rounds, firms take on more workers, and cyclical unemployment falls.
- Shocks are amplified. A fall in exports during a global downturn, or a collapse in business confidence that cuts investment, reduces national income by more than the initial fall. This helps explain why a recession can deepen.
- Inflation can follow. If the economy is close to full capacity, the multiplied increase in AD mainly pushes up the price level rather than real output.
Why the effect may be smaller or harder to predict
- Time lags. Each round takes time, so the full effect can take months or years to appear.
- Uncertainty about the size. The marginal propensities are not known precisely, and they change. Households worried about losing their jobs may save more of any extra income, which lowers the MPC just when the government wants a large multiplier.
- Leakages in an open economy. Where a high proportion of extra spending goes on imports, much of the multiplier effect benefits other countries.
- Where the extra income goes. Lower-income households tend to spend a higher proportion of extra income than higher-income households, so the size of the multiplier depends on who receives the injection.
AD and the level of economic activity
When an injection changes, AD shifts by more than the initial change:
final shift in AD = multiplier × initial change in injection
What happens to real output then depends on aggregate supply. If there is plenty of spare capacity, most of the shift in AD raises real output and employment. Close to full capacity, more of it raises the price level.
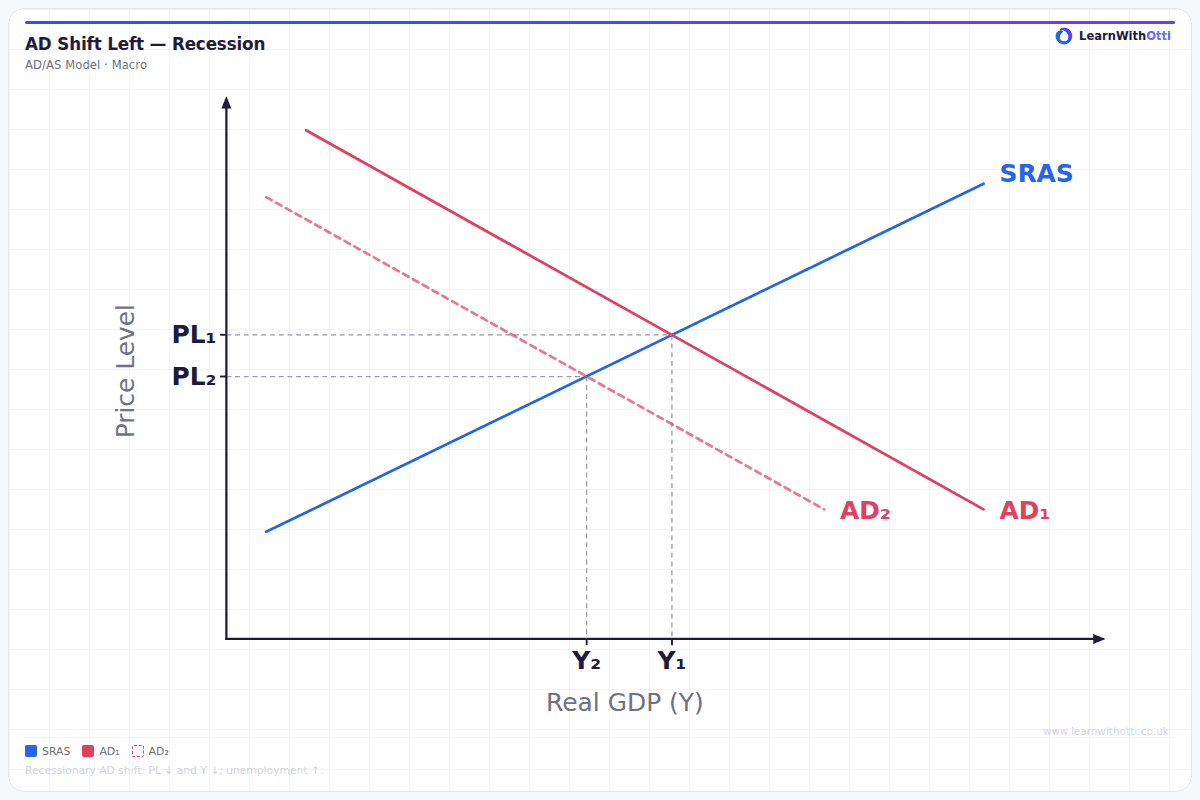
A fall in AD works the same way in reverse: real output falls, and unemployment rises. A large fall in AD can push the economy into recession.
Watch out: When the AS curve slopes upwards, the rise in real output is smaller than the full horizontal shift in AD, because part of the extra demand is absorbed by higher prices.
Key terms
| Term | Meaning |
|---|---|
| Multiplier ratio | Final change in real national income ÷ initial change in injections |
| Multiplier process | Successive rounds of spending in which one person's spending becomes another's income |
| Marginal propensity to consume (MPC) | The proportion of extra income spent on domestic output |
| Marginal propensity to save (MPS) | The proportion of extra income saved |
| Marginal propensity to tax (MPT) | The proportion of extra income taken in tax |
| Marginal propensity to import (MPM) | The proportion of extra income spent on imports |
| Marginal propensity to withdraw (MPW) | MPS + MPT + MPM |
| Negative multiplier | A fall in injections reducing national income by more than the initial fall |
Common mistakes
- Confusing marginal with average. The MPC is the proportion of extra income spent, not the proportion of total income spent.
- Using the wrong formula. Use 1 ÷ (1 − MPC). Do not divide 1 by the MPC.
- Stopping at the multiplier. If you are asked for the change in national income, multiply the multiplier by the initial injection.
- Assuming the whole shift in AD becomes extra real output. How much becomes real output depends on spare capacity.
How this has been examined
In the AQA papers indexed on this site, this topic has appeared in three formats:
- 15-mark "Explain" essay — asked once (2024)
- 9-mark "Explain" data response — asked 3 times across 3 series (2019 to 2025)
- 1-mark multiple choice — asked 4 times across 4 series (2017 to 2023)
Where this goes next
The multiplier builds on the injections and withdrawals in 4.2.2.1 The circular flow of income and on the AD/AS analysis in 4.2.2.2 Aggregate demand and aggregate supply analysis. The injections that start the process, and the accelerator that can reinforce it, are covered in 4.2.2.3 The determinants of aggregate demand. The multiplier explains why demand-side policy can affect output and employment, covered in 4.2.3.1 Economic growth and the economic cycle and 4.2.5.1 Fiscal policy.
Otti is an AI tutor built for A-Level students. Ask it anything, practise exam questions, and get instant feedback written like an examiner would give it — not just right or wrong, but why.
Get one answer marked free