AQA A-Level Economics · Revision notes
4.1.5.10 Market Structure, Static Efficiency, Dynamic Efficiency and Resource Allocation
Efficiency is the standard used to judge every market structure. A market can be efficient in several different senses, and a structure that performs well on one can perform badly on another. This page defines four of them, separates static from dynamic efficiency, and shows how they vary between market structures.
Allocative efficiency
Allocative efficiency occurs when resources are allocated to produce the goods and services consumers value most. The condition is:
Price (P) = marginal cost (MC)
Price reflects the value consumers place on the last unit, because it is what they are willing to pay for it. Marginal cost reflects the value of the resources used to produce it.
- If P is greater than MC, consumers value one more unit more than it costs to produce, so society would gain from producing more. Output is too low.
- If P is less than MC, the last unit costs more to produce than consumers value it, so output is too high.
Only where P = MC is output at the level society values most.
Productive efficiency
Productive efficiency occurs when a firm produces at the lowest possible average cost. The condition is:
Output at the minimum point of the average cost (AC) curve, which is where MC = AC
At this point, the firm is using the fewest resources possible per unit of output. For an economy as a whole, productive efficiency means producing on the production possibility frontier, where no more of one good can be made without making less of another.
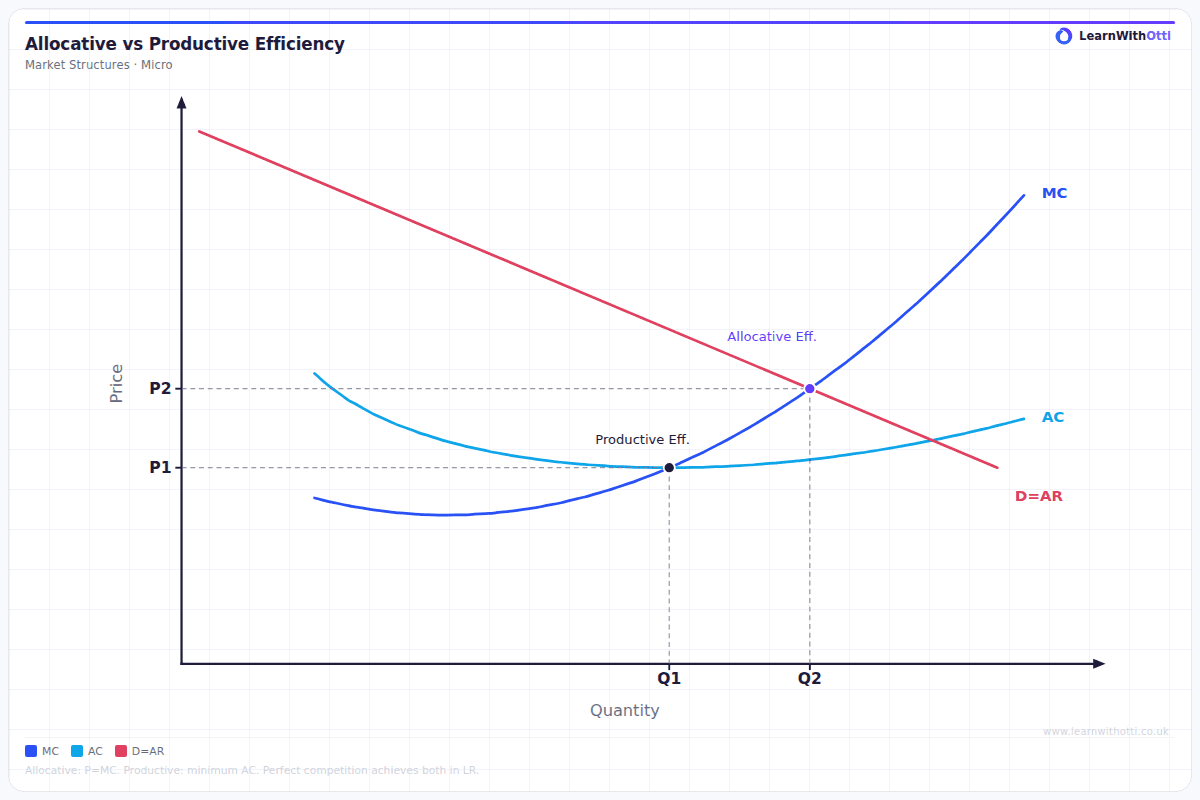
Allocative and productive efficiency together are often called static efficiency, because they describe efficiency at a single point in time.
Dynamic efficiency
Dynamic efficiency is about improvements over time: new products, better quality and lower costs through innovation and investment.
It depends on whether firms have the ability and the incentive to invest:
- Firms need profits to fund research and development and new capital. Firms earning supernormal profit in the long run, such as monopolies and large oligopolists, have the funds.
- Firms also need a reason to innovate. Competition provides it: firms that do not improve lose customers to those that do.
Dynamic efficiency is influenced by spending on research and development, by investment in both human capital (such as training and skills) and non-human capital (such as new machinery), and by technological change, which can create new products and cut costs.
Evaluation: There is a tension between the two. Competitive markets provide the incentive but may leave firms without the profits to invest. Markets with few firms provide the profits but may reduce the pressure to use them well.
X-inefficiency
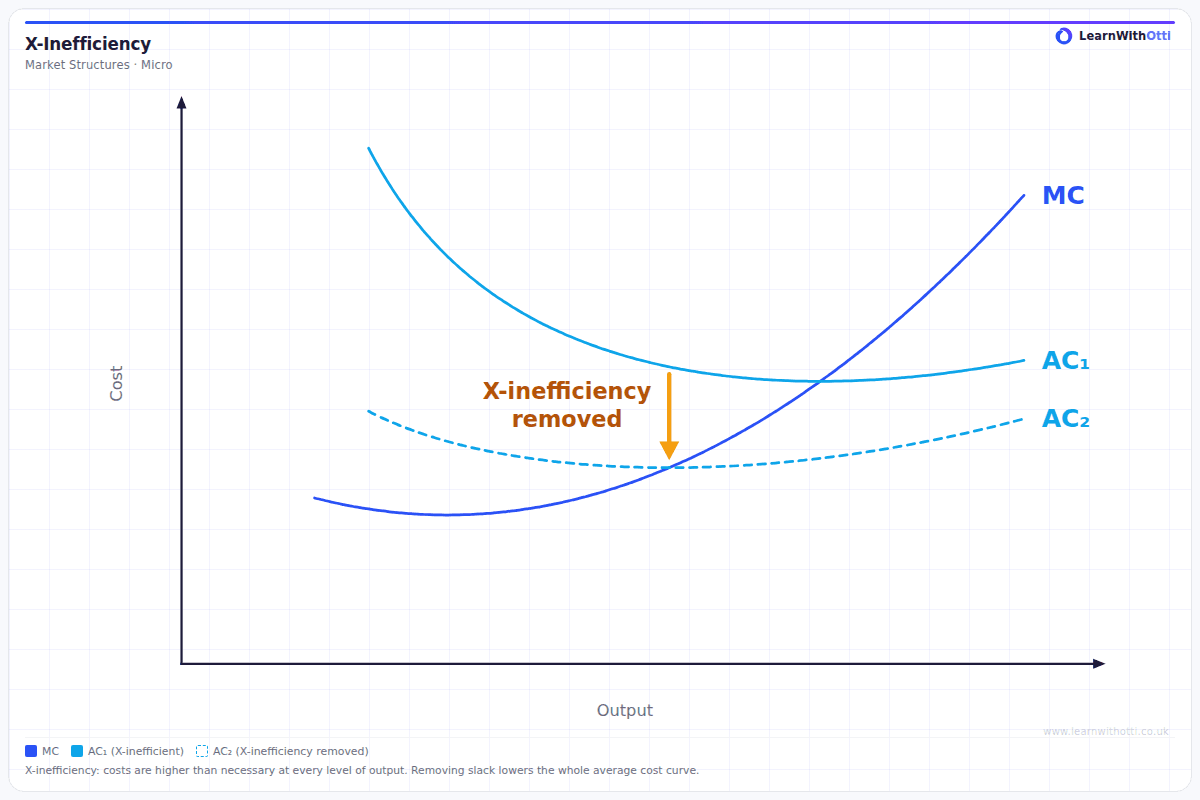
Key distinction: X-inefficiency occurs when a firm's costs are higher than they need to be for the output it produces. The firm is producing above its lowest possible average cost curve, not just at the wrong point on it.
It is caused by organisational slack: overstaffing, wasteful use of materials, paying more than necessary to suppliers, or managers who have no reason to control costs. It is most likely where firms face little competition, such as monopolies and state-owned enterprises, because they can survive with higher costs. In a competitive market, a firm with excess costs would be undercut by rivals.
Efficiency in different market structures
Market structures can be compared using conduct indicators, such as how firms set prices, whether they collude and how much they spend on advertising and research, and performance indicators, such as prices, profits, costs, efficiency and the rate of innovation. The table compares the main structures on efficiency.
| Market structure | Allocative | Productive | Dynamic | X-inefficiency |
|---|---|---|---|---|
| Perfect competition (long run) | Yes, P = MC | Yes, at minimum AC | Limited: only normal profit to invest | Unlikely: competition removes slack |
| Monopolistic competition (long run) | No, P is greater than MC | No, output below minimum AC | Some, through product innovation | Limited |
| Oligopoly | Usually no | Usually no | Possible: supernormal profit funds research | Possible, especially if firms collude |
| Monopoly | No, P is greater than MC | Usually no | Possible: supernormal profit funds research | Likely, with no competitive pressure |
Evaluation: The table shows why judging market structures is rarely straightforward. Perfect competition achieves static efficiency but may lack dynamic efficiency. Monopoly fails on static efficiency but may be dynamically efficient.
A natural monopoly may even have lower costs than any competitive market could, because of large economies of scale.
Key terms
| Term | Meaning |
|---|---|
| Allocative efficiency | Producing the goods consumers value most, where price equals marginal cost |
| Productive efficiency | Producing at the lowest possible average cost, where MC = AC |
| Static efficiency | Allocative and productive efficiency at a point in time |
| Dynamic efficiency | Improvements in products and processes over time through innovation and investment |
| X-inefficiency | Costs higher than necessary for a given output, due to a lack of competitive pressure |
Common mistakes
- Mixing up the two conditions. Allocative efficiency is P = MC; productive efficiency is the minimum of AC, where MC = AC.
- Treating X-inefficiency as producing at the wrong point. It means the whole cost curve is higher than necessary.
- Assuming competition is always best. Perfect competition is statically efficient but may lack dynamic efficiency.
- Ignoring economies of scale. A monopoly may produce at lower cost than many small firms could.
- Describing efficiency without a condition or diagram. Each type has a precise condition that should be stated.
How this has been examined
In the AQA papers indexed on this site, this topic has appeared in three formats:
- 25-mark "Assess" essay — asked once (2021)
- 4-mark "Explain" data response — asked once (2017)
- 1-mark multiple choice — asked once (2024)
Where this goes next
The cost curves behind productive efficiency are in 4.1.4.4 Costs of production, and economies of scale in 4.1.4.5 Economies and diseconomies of scale. Each market structure is analysed in turn in 4.1.5.3 Perfect competition, 4.1.5.4 Monopolistic competition, 4.1.5.5 Oligopoly and 4.1.5.6 Monopoly and monopoly power. The production possibility frontier view of efficiency is in 4.1.1.5 Production possibility diagrams, and the role of innovation in 4.1.4.8 Technological change. Welfare losses from inefficiency are measured in 4.1.5.11 Consumer and producer surplus.
Otti is an AI tutor built for A-Level students. Ask it anything, practise exam questions, and get instant feedback written like an examiner would give it — not just right or wrong, but why.
Get one answer marked free