AQA A-Level Economics · Revision notes
4.2.2.1 The Circular Flow of Income
National income is the total income earned in an economy over a period of time. The circular flow of income is the simplest model of how that income moves around the economy, and it underpins everything that follows in macroeconomics. This topic covers what national income measures, the difference between nominal and real income, the circular flow and the equation income = output = expenditure, injections and withdrawals, and the concepts of equilibrium and full employment income.
What national income measures
Because the flow of income is circular, the same total can be measured at three points:
- National income: the total of all incomes earned (wages, rent, interest and profit).
- National output: the total value of all goods and services produced.
- National expenditure: the total amount spent on those goods and services.
Nominal and real income
- Real versus nominal. Real is adjusted for inflation; nominal is measured at the prices of the day.
Key idea: The word real is doing essential work. Nominal GDP can rise simply because prices rose, without a single extra good being produced. Real GDP strips inflation out, so a rise means the economy genuinely produced more.
This is why real national income is used as the main indicator of economic performance. A rise in real national income means the economy has produced more goods and services, and the rate of economic growth is the percentage change in real GDP from one period to the next.
The circular flow of income
The simplest version of the model has two groups of economic agents:
- Households, who own the factors of production (land, labour, capital and enterprise) and consume goods and services.
- Firms, who hire the factors of production and use them to produce goods and services.
They meet in two markets. In the factor market, households sell the use of their factors of production to firms. In the goods and services market, firms sell their output to households. Two flows move in opposite directions through these markets.
The real flow (inner loop on the diagram)
- Households supply factors of production to firms: their labour, and the use of their land and capital.
- Firms supply goods and services to households.
The money flow (outer loop on the diagram)
- Firms pay households for the factors of production, in the form of wages, rent, interest and profit. This is household income.
- Households spend that income on the goods and services firms produce. This is spending, or expenditure.
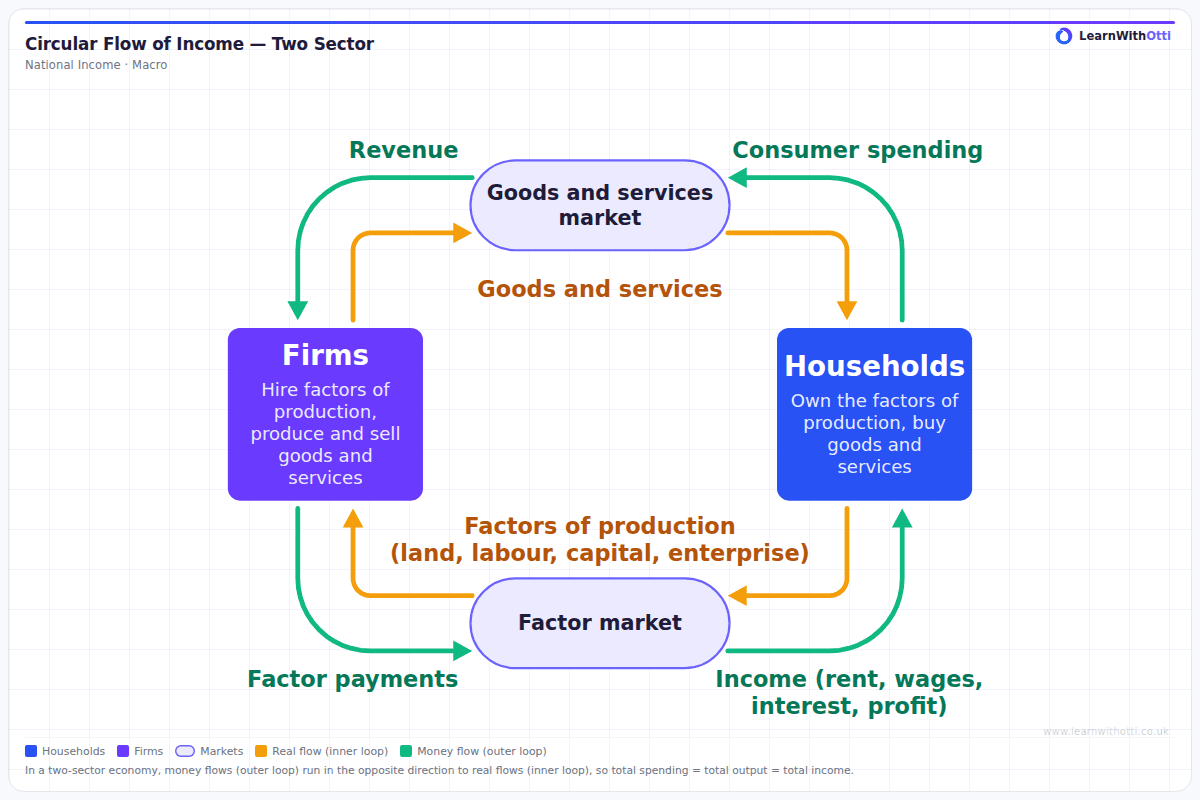
In this simple model, all income is spent, so the money flowing from households to firms is exactly equal to the money flowing from firms to households. The flow continues around the circle at the same level.
Income = output = expenditure
In principle, the three measures of national income are all equal:
National income = national output = national expenditure
Key idea: Every pound spent on output becomes someone's income, and every unit of output is valued at what is spent on it.
In practice, the three measures give slightly different figures because of gaps and errors in the data, and statisticians adjust them so they agree.
Withdrawals
The simple circular flow assumes households spend all their income. In reality, some money leaves the flow and some new money enters it.
A withdrawal (or leakage) is money that leaves the circular flow and is not passed on as spending on domestic output. There are three:
- Saving (S). Income that households do not spend, such as money put into a savings account.
- Taxation (T). Income taken by the government, such as income tax and VAT.
- Imports (M). Spending on goods and services produced abroad, so the money flows out of the domestic economy.
Total withdrawals = saving + taxation + imports (S + T + M)
Injections
An injection is spending on domestic output that does not come from households' consumption of their current income. There are three:
- Investment (I). Spending by firms on capital goods, such as machinery and buildings.
- Government spending (G). Spending by the government on goods and services, such as health care and roads.
- Exports (X). Spending by foreign consumers and firms on goods and services produced in the UK.
Total injections = investment + government spending + exports (I + G + X)
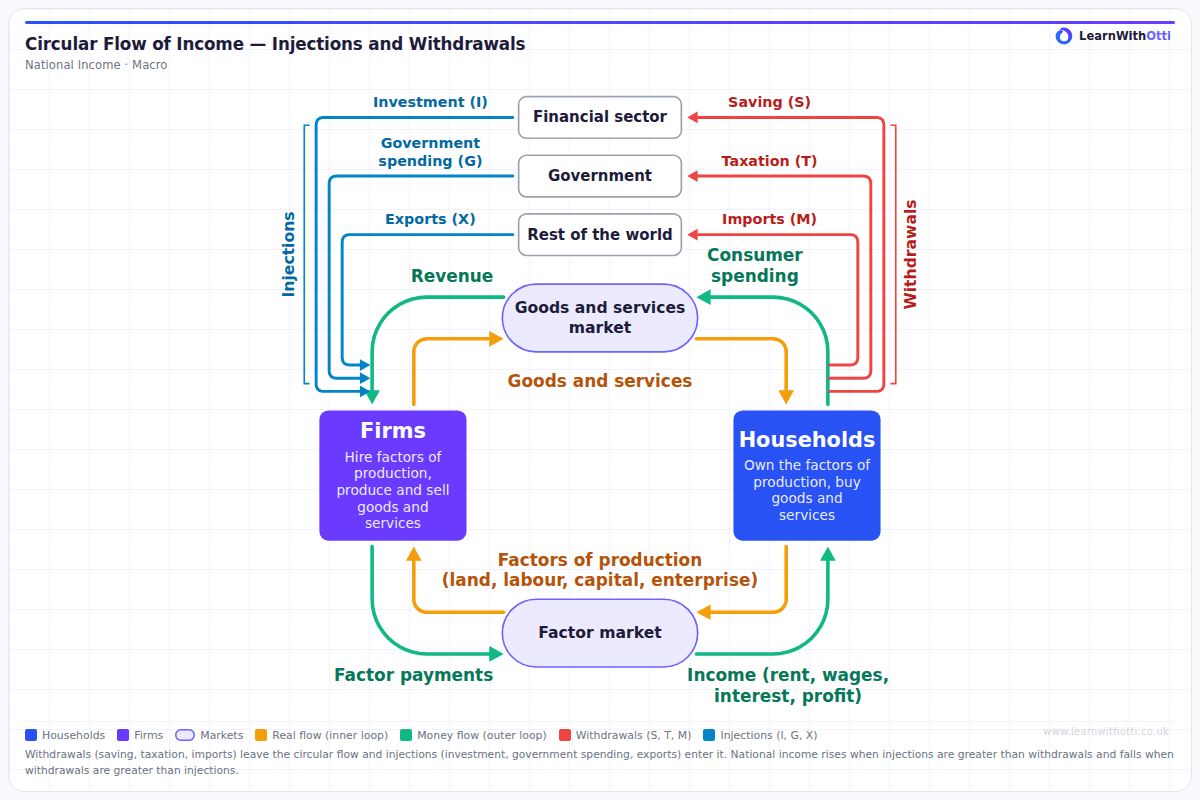
On the diagram, each withdrawal is paired with an injection through the same sector. Saving goes to the financial sector, which lends for investment. Taxation goes to the government, which spends it. Spending on imports goes to the rest of the world, which buys exports. The pairs do not have to match individually. What matters is the total of all three injections compared with the total of all three withdrawals.
The impact of injections and withdrawals
What happens to national income depends on how total injections compare with total withdrawals.
If injections are greater than withdrawals
More money is entering the flow than leaving it. Spending on domestic output rises, firms produce more, and incomes rise. National income increases.
For example, a rise in government spending on infrastructure, or a rise in exports, increases the flow of income around the economy.
If withdrawals are greater than injections
More money is leaving the flow than entering it. Spending on domestic output falls, firms cut production, and incomes fall. National income decreases.
For example, if households become worried about the future and save more, spending falls and national income shrinks.
If injections equal withdrawals
The money entering the flow exactly matches the money leaving it, so national income stays the same. The economy is in equilibrium:
Equilibrium: injections = withdrawals (I + G + X = S + T + M)
How the economy returns to equilibrium
Changes in national income themselves change withdrawals. When national income rises, households save more, pay more tax and buy more imports. So rising income increases withdrawals until they again equal injections, and a new, higher equilibrium is reached.
The same works in reverse. When national income falls, saving, tax and imports all fall, until withdrawals once more equal injections at a lower level of income.
Equilibrium and full employment income
Full employment income is the level of national income at which the economy's resources, including labour, are fully employed. Equilibrium national income need not be the same as full employment income. If injections are low, injections equal withdrawals at a level of income below full employment, so the economy settles at an equilibrium with unemployed workers and spare capacity. Raising injections, for example through higher government spending, can move equilibrium income closer to the full employment level.
A note on saving
Saving is a withdrawal from the circular flow in the short run, which is why an increase in saving can reduce national income. But saving is not lost from the economy entirely. Banks lend saved money to firms and households, which can finance investment, an injection.
Evaluation: Whether higher saving reduces national income depends on whether it is matched by higher investment.
The idea that higher saving by everyone can reduce national income, and may even leave total saving no higher, is known as the paradox of thrift.
Key terms
| Term | Meaning |
|---|---|
| National income | The total income earned in an economy over a period of time |
| Circular flow of income | A model showing how income and spending flow between households and firms |
| Real flow | The flow of factors of production and goods and services |
| Money flow | The flow of income and spending |
| Real income | Income adjusted for inflation |
| Nominal income | Income measured at current prices |
| Withdrawal (leakage) | Money that leaves the circular flow: saving, taxation or imports |
| Injection | Spending on domestic output that does not come from current household consumption: investment, government spending or exports |
| Equilibrium national income | The level at which total injections equal total withdrawals |
| Full employment income | The level of national income at which the economy's resources are fully employed |
| Paradox of thrift | The idea that an increase in saving by everyone can reduce national income |
Common mistakes
- Drawing the flows in the wrong direction. Factors of production flow from households to firms; incomes flow from firms to households.
- Forgetting the real flow. The circular flow includes goods, services and factors of production, not just money.
- Mixing up injections and withdrawals. Saving, taxes and imports leave the flow; investment, government spending and exports enter it.
- Listing them without the effect. The key point is whether injections are greater or less than withdrawals, and what that does to national income.
- Treating saving as always harmful. Saving can finance investment; the effect depends on whether it is matched by investment.
- Comparing individual items. Equilibrium needs total injections to equal total withdrawals, not each pair, such as saving and investment, to match.
How this has been examined
In the AQA papers indexed on this site, this topic has appeared in one format:
- 1-mark multiple choice — asked 3 times across 3 series (2018 to 2024)
Where this goes next
The use of real national income data to judge living standards is covered in 4.2.1.4 Uses of national income data. The components of spending that make up the injections are covered in 4.2.2.3 The determinants of aggregate demand, and the way a change in injections changes national income by more than the initial amount in 4.2.2.4 Aggregate demand and the level of economic activity. Equilibrium is analysed using AD and AS in 4.2.2.2 Aggregate demand and aggregate supply analysis.
Otti is an AI tutor built for A-Level students. Ask it anything, practise exam questions, and get instant feedback written like an examiner would give it — not just right or wrong, but why.
Get one answer marked free