AQA A-Level Economics · Revision notes
4.2.2.2 Aggregate Demand and Aggregate Supply Analysis
Aggregate demand and aggregate supply together determine the economy's price level and its real output. This topic introduces the AD and AS curves, the difference between a movement along each curve and a shift, the factors that shift AD, short-run AS and long-run AS, and how to use AD/AS diagrams to show macroeconomic equilibrium, demand-side and supply-side shocks, and economic growth.
The AD curve
Aggregate demand (AD) is the total planned spending on an economy's goods and services at a given price level over a period of time.
AD = C + I + G + (X − M)
The AD curve plots the real output demanded against the price level. It slopes downwards from left to right: a fall in the price level raises the quantity of real output demanded.
Three reasons explain the slope:
- The wealth effect. A lower price level raises the real value of people's money and savings, so they feel wealthier and spend more.
- The interest rate effect. A lower price level means people need less money for transactions, so interest rates tend to fall, encouraging borrowing to spend and invest.
- The international trade effect. A lower UK price level makes UK goods cheaper relative to foreign goods, so exports rise and imports fall.
The AS curve
Aggregate supply (AS) is the total output that all the firms in an economy are willing and able to produce at each price level, over a given period.
The AS curve is drawn on the same axes as aggregate demand: the price level on the vertical axis and real national output (real GDP) on the horizontal axis.
Economists distinguish two versions:
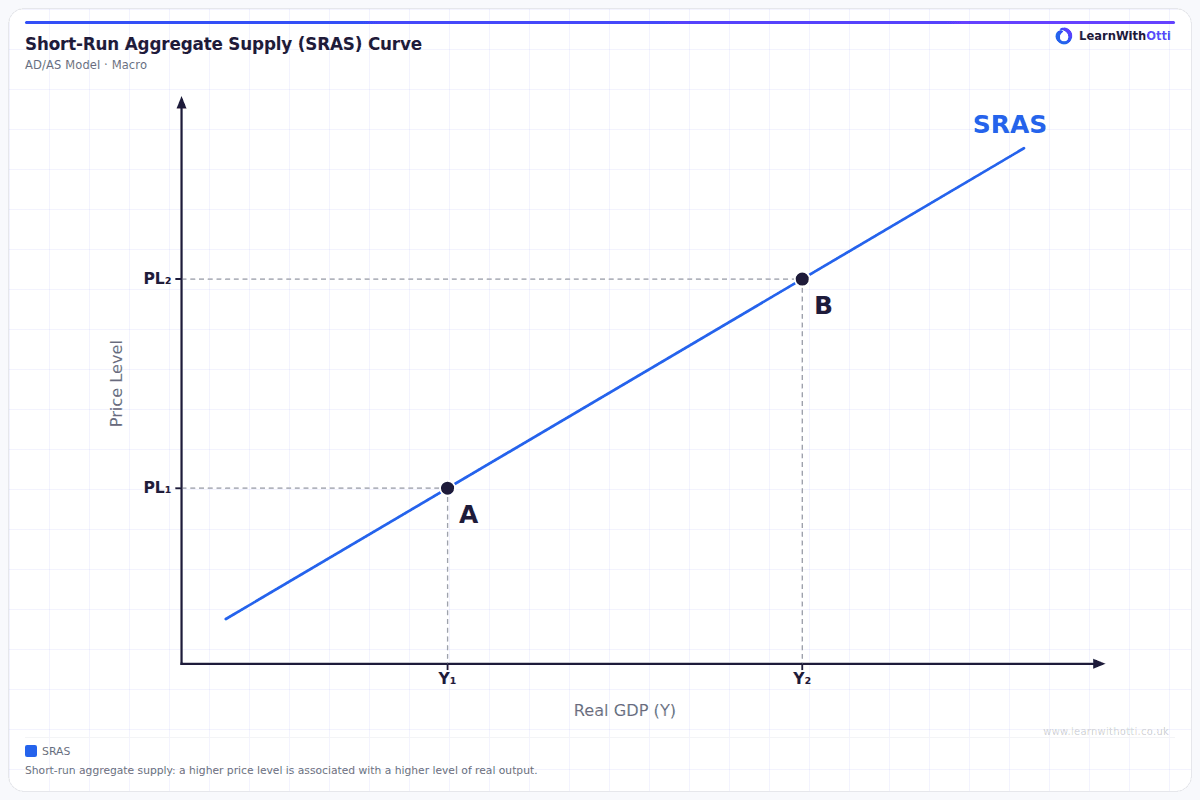
- Short-run aggregate supply (SRAS) shows how much firms produce at each price level using the current factors of production.
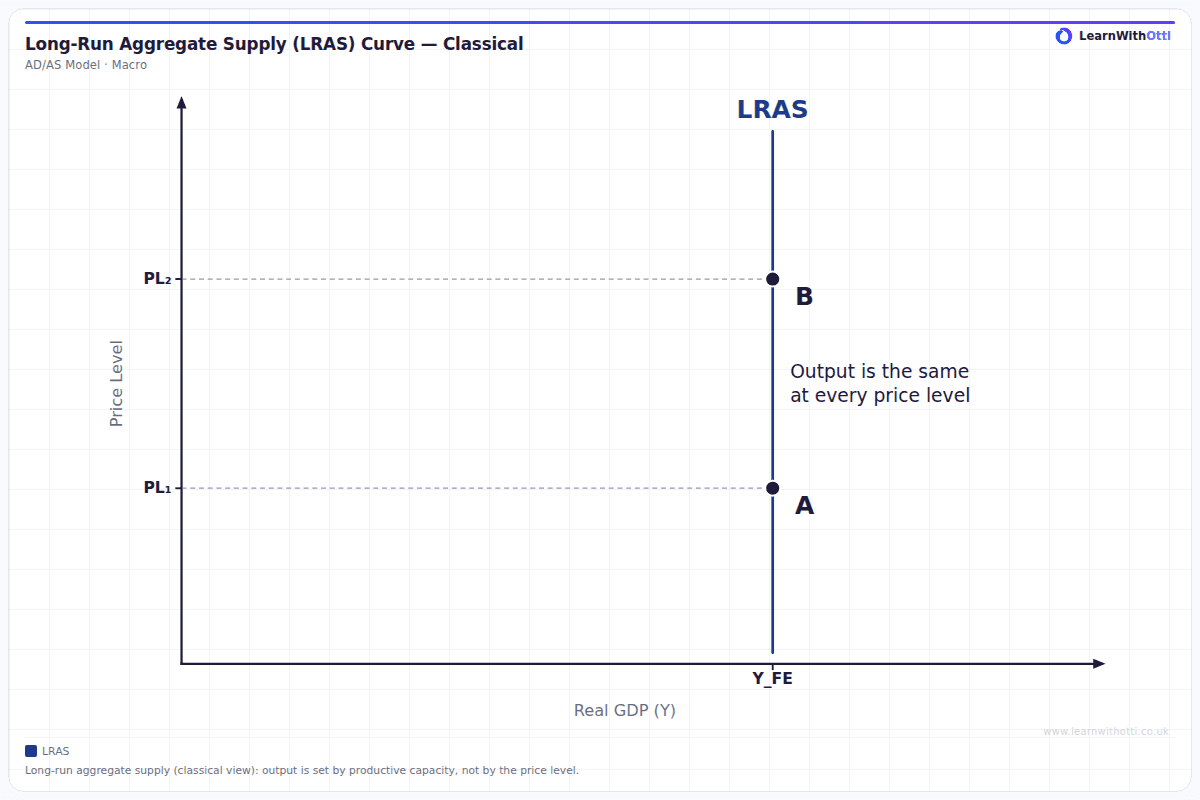
- Long-run aggregate supply (LRAS) shows the economy's productive capacity: the maximum output it can sustain when all factors of production are fully employed.
Why the SRAS curve slopes upwards
In the short run, many of a firm's costs are fixed or slow to change. Wages, for example, are set in contracts and agreed only once a year. If the general price level rises while costs stay the same, each unit of output becomes more profitable, so firms produce more.
As output rises, firms also have to pay overtime, use older or less efficient machinery and bid for scarcer resources, so their costs rise. They will only supply more if prices rise to cover those costs. Both effects give an upward-sloping SRAS curve.
Movements along and shifts of the AD curve
A movement along the AD curve is caused only by a change in the price level. A rise in the price level causes a contraction in the real output demanded; a fall causes an extension.
A shift of the AD curve is caused by a change in any component of AD at a given price level.
AD shifts right when, for example:
- consumer confidence or household wealth rises;
- interest rates are cut, encouraging borrowing for consumption and investment;
- income tax is cut, raising disposable income;
- government spending increases;
- demand for exports rises, or the exchange rate depreciates.
AD shifts left for the opposite reasons, such as a rise in interest rates, a fall in confidence, or a recession in a major trading partner.
Watch out: The distinction matters because the cause determines the diagram. A change in the price level cannot shift the AD curve, since the price level is on the axis.
Movements along and shifts of the AS curves
Key distinction: A movement along the SRAS curve is caused by a change in the price level. This usually happens because aggregate demand has changed.
If AD increases, the price level rises and firms respond by producing more: the economy moves up along the existing SRAS curve.
A shift of the SRAS curve is caused by a change in firms' costs of production at every price level. For example:
- a rise in wages, raw material prices or energy prices shifts SRAS to the left: at every price level, firms produce less;
- a fall in those costs, or a rise in productivity, shifts SRAS to the right.
A shift of the LRAS curve is caused by a change in the economy's productive capacity: the quantity or quality of its factors of production. More workers, better skills, more capital and new technology shift LRAS to the right. These factors are covered in 4.2.2.6 Determinants of long-run aggregate supply, and the factors that shift SRAS in 4.2.2.5 Determinants of short-run aggregate supply.
Key distinction: SRAS shows what firms will produce in the short run, before costs have adjusted. LRAS shows what the economy can produce in the long run, once all prices and wages have adjusted.
Macroeconomic equilibrium
Equilibrium real national output is the level of output at which aggregate demand equals aggregate supply. At this point, the total amount that households, firms, the government and foreign buyers want to spend on domestic output is exactly matched by the amount firms want to produce.
- In the short run, equilibrium is where the AD curve crosses the SRAS curve.
- In the long run, in the classical view, the economy settles where AD crosses SRAS on the LRAS curve, at full capacity.
Why the economy moves towards equilibrium
- If AD is greater than AS at the current price level, there is excess demand. Firms run down their stocks, raise prices and increase output, moving the economy towards equilibrium.
- If AD is less than AS, firms cannot sell everything they produce. Unsold stocks build up, and firms cut prices and output.
Watch out: Equilibrium is not necessarily a good outcome. An economy can be in equilibrium with high unemployment, below its productive capacity.
Demand-side shocks
A shift in AD is caused by a change in consumption, investment, government spending or net trade.
An increase in AD (a shift to the right):
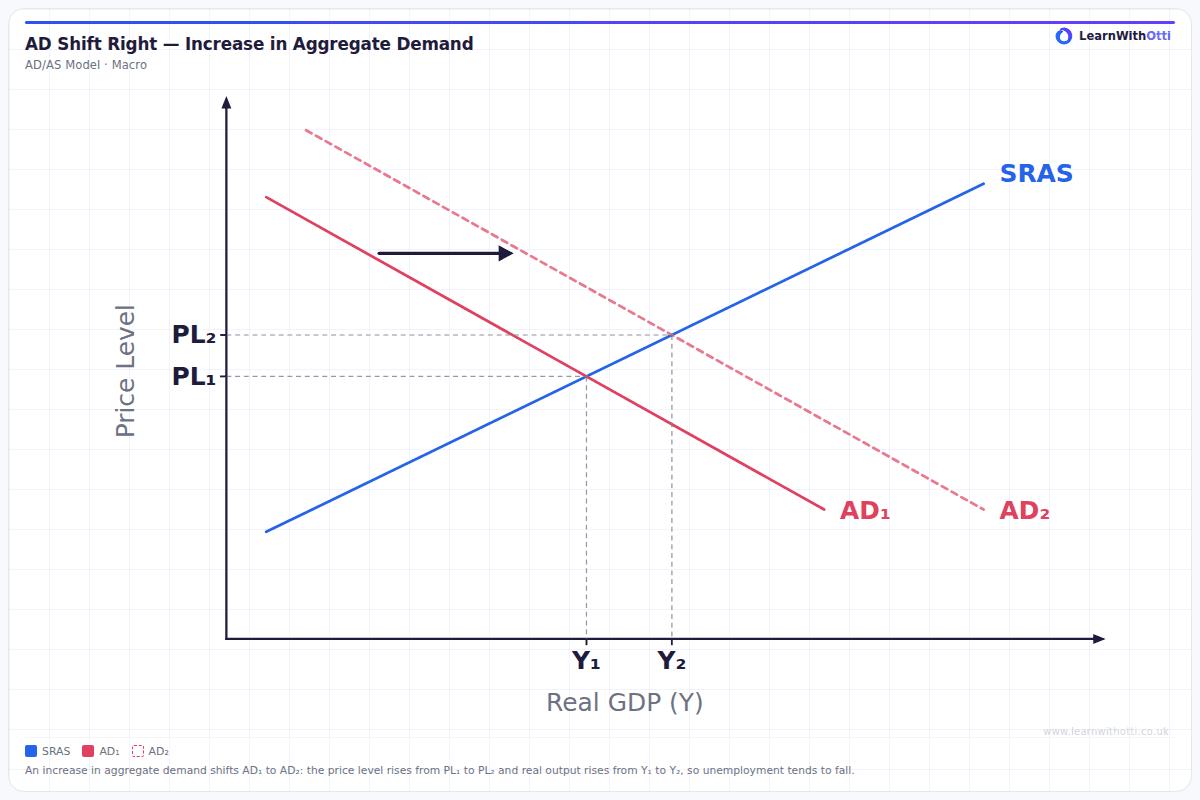
- the price level rises;
- real output rises, and unemployment tends to fall.
Evaluation: How much of the effect falls on output and how much on prices depends on how close the economy is to full capacity. With a lot of spare capacity, most of the effect is on output. Close to full capacity, most of it is on prices, which is demand-pull inflation.
A decrease in AD (a shift to the left):
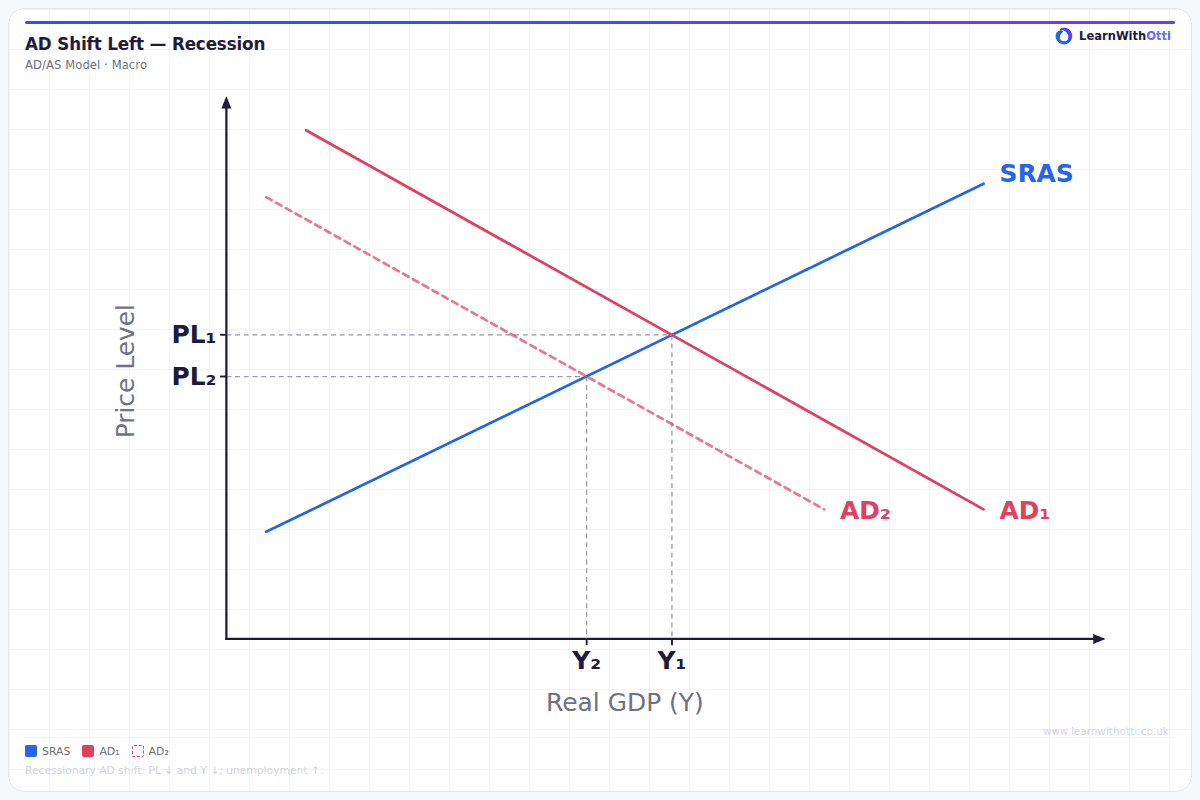
- the price level falls, or rises more slowly;
- real output falls, and unemployment rises. A large fall in AD can push the economy into recession.
The unemployment caused by a fall in AD is demand-deficient (cyclical) unemployment: firms produce less, so they need fewer workers.
Supply-side shocks
A shift in SRAS is caused by a change in firms' costs.
A decrease in SRAS (a shift to the left), for example from a rise in energy prices:
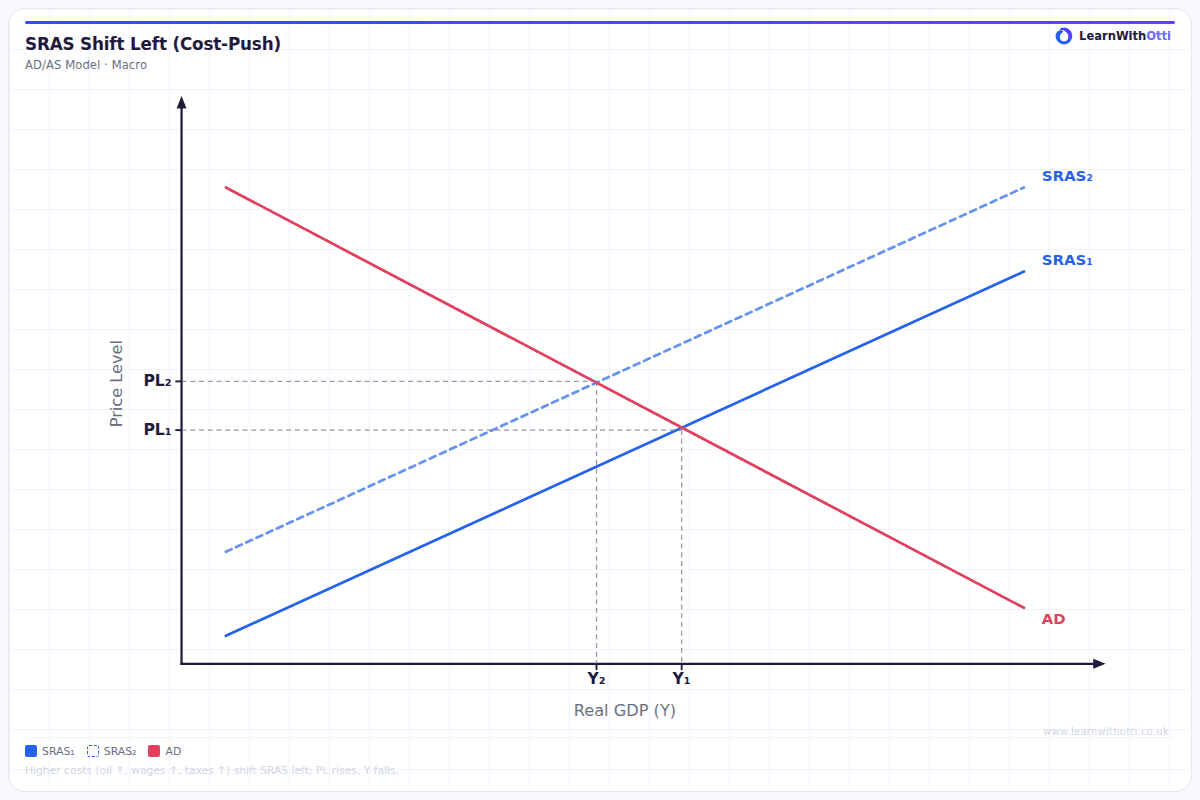
- the price level rises, which is cost-push inflation;
- real output falls, and unemployment rises.
Evaluation: This combination of rising prices and falling output is especially difficult for policymakers, because measures to reduce inflation make the fall in output worse.
An increase in SRAS (a shift to the right) lowers the price level and raises real output.
Economic growth: a shift in long-run aggregate supply
A shift in LRAS is caused by a change in the quantity or quality of the factors of production.
An increase in LRAS (a shift to the right):
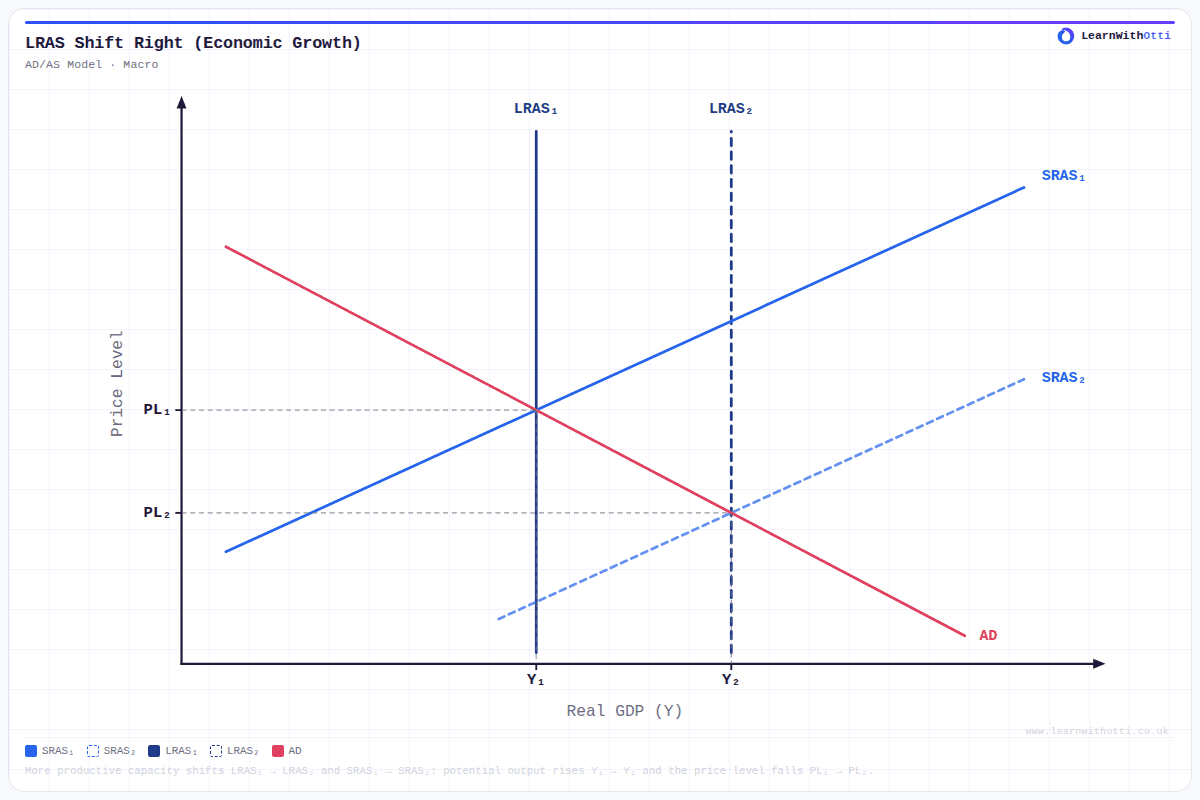
- the economy's productive capacity rises;
- real output can rise without the price level rising, so growth is achieved without inflation.
This is the most desirable kind of change, because it raises potential output and living standards. But it usually takes years to achieve.
Global events and the domestic economy
International trade links economies together, so events in one country affect others.
- A recession in a major trading partner reduces demand for UK exports, slowing growth and raising unemployment in the UK.
- Growth in trading partners raises demand for UK exports.
- Supply shocks travel through trade. A rise in global energy prices raises costs in every country that imports energy.
- Global supply chains mean that disruption in one country can halt production in another.
The more open an economy is to trade, the more exposed it is to these effects.
Using AD/AS diagrams
When analysing any change in the economy:
- Identify which curve is affected: AD, SRAS or LRAS.
- Decide which way it shifts, and explain why.
- Show the new equilibrium, with the new price level and real output.
- Explain the effect on the price level, real output and, where relevant, unemployment.
- Consider whether the economy is close to full capacity, which affects how much of a change in AD shows up in output rather than prices.
Key terms
| Term | Meaning |
|---|---|
| Aggregate demand | Total planned spending on an economy's goods and services at a given price level |
| Aggregate supply | The total output firms are willing and able to produce at each price level |
| Short-run aggregate supply | How much firms produce at each price level using the current factors of production |
| Long-run aggregate supply | The economy's productive capacity when all factors are fully employed |
| Wealth effect | The change in spending when the real value of wealth changes with the price level |
| Shift in AD | A change in AD at every price level, caused by a change in a component |
| Equilibrium real national output | The output at which aggregate demand equals aggregate supply |
| Demand-pull inflation | Inflation caused by aggregate demand growing faster than aggregate supply |
| Cost-push inflation | Inflation caused by rising costs of production |
| Spare capacity | Unused resources that could be brought into production |
Common mistakes
- Shifting AD for a change in the price level. A price level change is a movement along the curve.
- Using microeconomic reasons for the slope. The AD curve slopes down for macroeconomic reasons, not because individual consumers substitute between goods.
- Shifting SRAS when the price level changes. A change in the price level causes a movement along SRAS. Only a change in costs shifts it.
- Shifting the wrong curve. A change in spending shifts AD; a change in costs shifts SRAS; a change in productive capacity shifts LRAS.
- Labelling the axes as price and quantity. In macroeconomics the axes are the price level and real national output.
- Ignoring the starting position. The effect of a rise in AD depends on how much spare capacity there is.
- Stating the effect on only one variable. Every shift changes both the price level and real output.
- Treating equilibrium as the ideal outcome. The economy can be in equilibrium with high unemployment.
How this has been examined
In the AQA papers indexed on this site, this topic has appeared in one format:
- 1-mark multiple choice — asked 4 times across 4 series (2018 to 2021)
Where this goes next
The components of AD and what determines them are covered in 4.2.2.3 The determinants of aggregate demand, and the size of the effect of a change in AD in 4.2.2.4 Aggregate demand and the level of economic activity. The factors that shift the AS curves are set out in 4.2.2.5 Determinants of short-run aggregate supply and 4.2.2.6 Determinants of long-run aggregate supply. AD/AS analysis is applied to growth, unemployment and inflation in 4.2.3.1 Economic growth and the economic cycle, 4.2.3.2 Employment and unemployment and 4.2.3.3 Inflation and deflation.
Otti is an AI tutor built for A-Level students. Ask it anything, practise exam questions, and get instant feedback written like an examiner would give it — not just right or wrong, but why.
Get one answer marked free