AQA A-Level Economics · Revision notes
4.1.5.6 Monopoly and Monopoly Power
A monopoly is a market with a single seller. It is the opposite extreme to perfect competition: one firm faces the whole market demand curve and has the power to set its own price. This page covers how a monopolist sets price and output, what determines the degree of monopoly power, who gains and loses from monopoly, and the special case of natural monopoly.
Characteristics of monopoly
- One firm supplies the whole market (a pure monopoly). In practice, the term is also used for a firm with a dominant share. In the UK, a firm with 25% or more of a market is sometimes described as a working monopoly or as having monopoly power for legal purposes.
- High barriers to entry, which stop new firms competing away its profits. These include economies of scale, control of essential resources, patents, legal rights, brand loyalty and high start-up costs.
- No close substitutes for its product.
- Price maker. The firm sets the price, but it cannot set both price and quantity: it faces the market demand curve, so to sell more it must lower its price.
- Aims to maximise profit.
Profit-maximising equilibrium
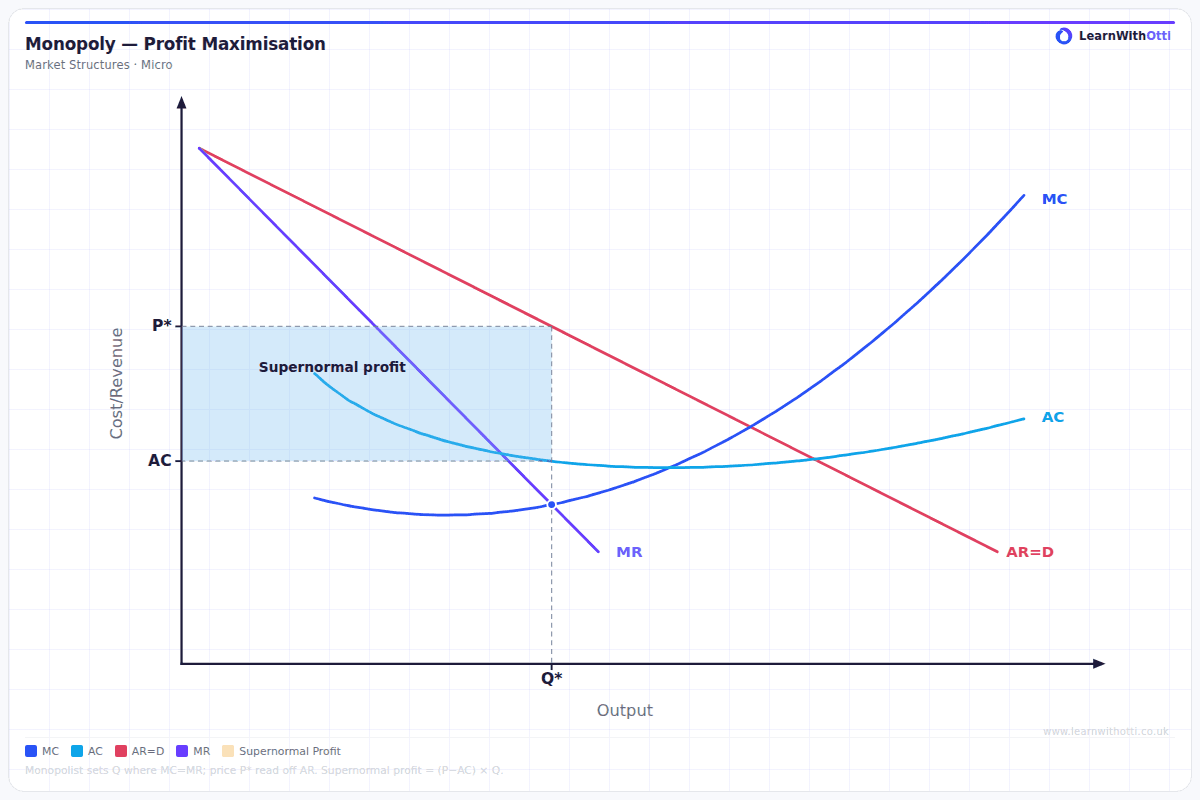
Because the monopolist faces a downward-sloping demand curve, its marginal revenue (MR) lies below average revenue (AR). It maximises profit where MC = MR.
- Find the output where MC cuts MR. This is the profit-maximising quantity.
- Read the price off the demand (AR) curve directly above that quantity.
- Compare price with average cost (AC) at that quantity. If price is above AC, the firm makes supernormal profit, shown by the rectangle between price and AC across the quantity sold.
Key idea: Because barriers to entry keep rivals out, supernormal profit can persist in the long run. This is the key difference from perfect and monopolistic competition.
Diagrammatic analysis and efficiency
The monopoly diagram shows AR and MR sloping downwards, with MC and AC curves. Compared with a competitive market with the same costs:
- Output is lower and price is higher. A competitive market would produce where price equals MC; the monopolist restricts output to where MC = MR.
- Not allocatively efficient, because price is above MC.
- Usually not productively efficient, because output is not at the minimum of AC.
- Deadweight welfare loss. The units between the monopoly output and the competitive output would have been worth more to consumers than they cost to produce, but are not produced. This lost welfare is a triangle between the demand curve and MC.
- X-inefficiency is likely, because with no rivals the firm has little pressure to control costs.
Monopoly power
Monopoly power is the ability of a firm to set its price above the competitive level. It is not limited to pure monopolies. Firms in monopolistic competition and oligopoly also face downward-sloping demand curves, so they are price makers with varying degrees of monopoly power. The degree of power depends on:
- barriers to entry, which protect the firm from new rivals
- the number of competitors, because fewer rivals means fewer substitutes
- advertising, which builds brand loyalty
- the degree of product differentiation, which makes rivals' products poorer substitutes.
The fewer and weaker the substitutes, the less price elastic demand is and the greater the firm's monopoly power.
Costs and benefits of monopoly
| Group | Possible costs | Possible benefits |
|---|---|---|
| Firms | Little pressure to keep costs down can lead to X-inefficiency | Supernormal profit; security to plan long term; funds for research and development |
| Consumers | Higher prices, lower output, less choice; possible complacency on quality | Lower prices if economies of scale are large; innovation funded by profits |
| Employees | A sole employer may hold down wages; fewer alternative employers | Profitable firms may offer secure jobs, training and higher pay |
| Suppliers | A dominant buyer may push down the prices it pays them | A large, stable customer with predictable orders |
Evaluation: The overall verdict depends on the market. A monopoly that exploits its power with high prices and poor service imposes clear costs. One that uses its profits to innovate, and reaches economies of scale that no smaller firm could, may serve consumers better than a competitive market would.
Natural monopoly
A natural monopoly occurs when one firm can supply the whole market at a lower average cost than two or more firms could. This happens when economies of scale are so large that long-run average cost is still falling at the level of output that meets the entire market demand.
Industries with very high fixed costs of infrastructure are typical: water pipes, electricity grids and railway track. It would be wasteful for two companies to lay parallel water pipes to every home.
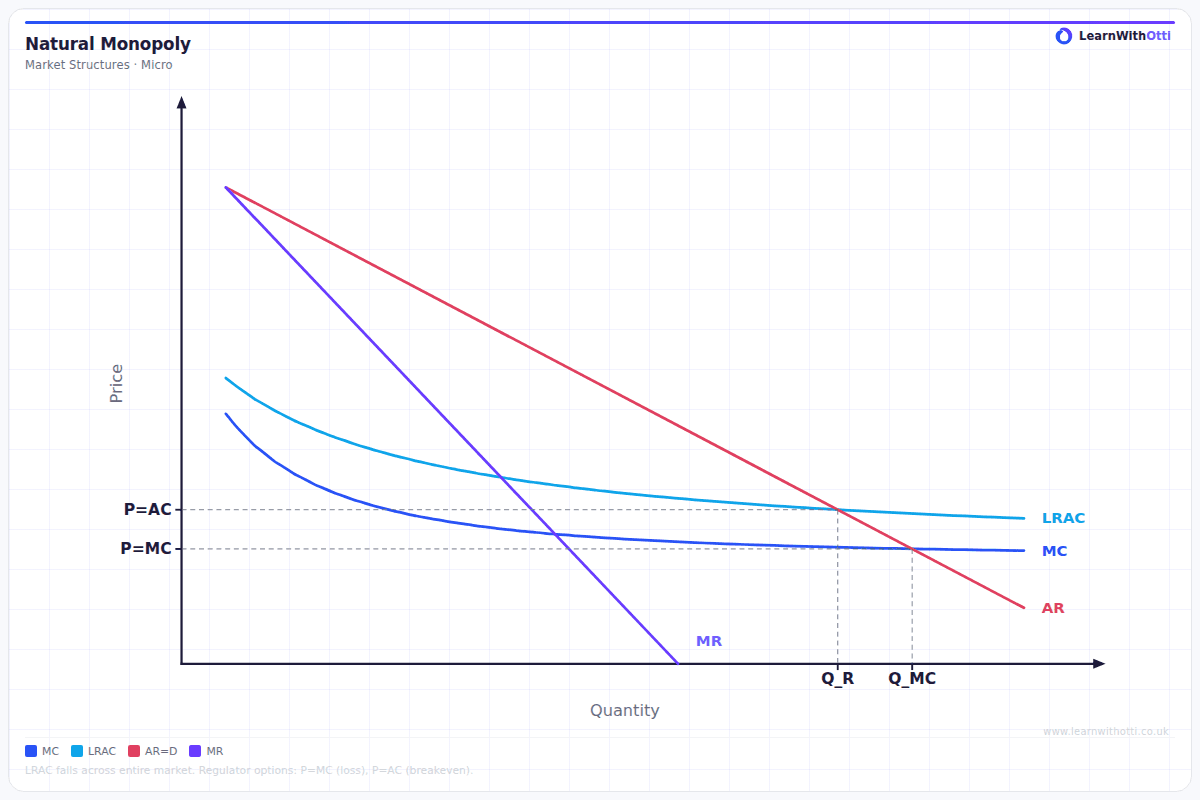
Key idea: Breaking a natural monopoly up would raise costs. So governments usually allow it to exist and then either run it in the public sector or regulate it, for example by capping prices, as with the UK's water and energy network regulators.
Key terms
| Term | Meaning |
|---|---|
| Monopoly | A market with a single seller, or one firm with a dominant market share |
| Price maker | A firm that can set its own price because it faces a downward-sloping demand curve |
| Monopoly power | The ability of a firm to set its price above the competitive level |
| Barriers to entry | Obstacles that prevent new firms from entering a market |
| Deadweight welfare loss | The loss of welfare from output being below the level where price equals marginal cost |
| Natural monopoly | A market where one firm can supply total demand at lower average cost than several firms |
Common mistakes
- Reading the price off the MR curve. The price is read off the demand (AR) curve above the profit-maximising output.
- Assuming a monopolist can charge any price it likes. It is constrained by the demand curve.
- Concluding monopoly is always bad. Economies of scale, natural monopoly and dynamic efficiency can benefit consumers.
How this has been examined
In the AQA papers indexed on this site, this topic has appeared in four formats:
- 9-mark "Explain" data response — asked twice across 2 series (2017 to 2021)
- 4-mark "Explain" data response — asked once (2018)
- 2-mark calculation — asked once (2017)
- 1-mark multiple choice — asked 3 times across 3 series (2017 to 2021)
Where this goes next
Profit maximisation and the revenue curves are covered in 4.1.5.2 The objectives of firms and 4.1.4.6 Marginal, average and total revenue, and the scale economies behind natural monopoly in 4.1.4.5 Economies and diseconomies of scale. Efficiency is compared across structures in 4.1.5.10 Market structure, static efficiency, dynamic efficiency and resource allocation, and charging different prices to different customers is covered in 4.1.5.7 Price discrimination. A single buyer, the mirror image of a monopolist, is covered in 4.1.6.4 The determination of relative wage rates and levels of employment in imperfectly competitive labour markets, and the threat of entry as a check on monopoly power in 4.1.5.9 Contestable and non-contestable markets. Government responses, including regulation and price caps, are in 4.1.8.7 Competition policy and 4.1.8.8 Public ownership, privatisation, regulation and deregulation of markets.
Otti is an AI tutor built for A-Level students. Ask it anything, practise exam questions, and get instant feedback written like an examiner would give it — not just right or wrong, but why.
Get one answer marked free