AQA A-Level Economics · Revision notes
4.2.3.1 Economic Growth and the Economic Cycle
Economic growth can come from the economy making fuller use of the resources it already has, or from an increase in the resources and know-how it has to work with. Telling these apart is the key to this topic. It covers short-run and long-run growth and their causes, the costs and benefits of growth, the economic cycle and what drives it, and positive and negative output gaps.
Short-run and long-run growth
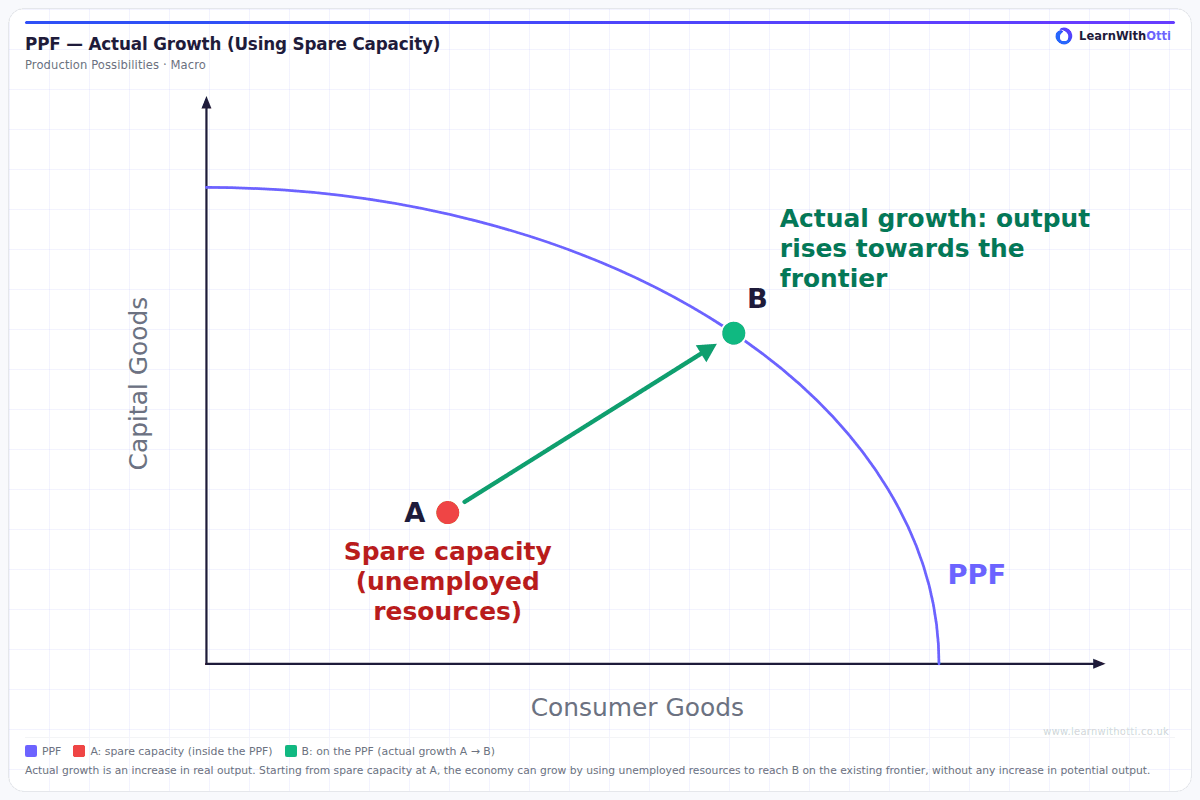
Actual growth is an increase in real GDP: the economy actually produces more goods and services than before. It is measured by the percentage change in real GDP.
Potential growth is an increase in the economy's productive capacity: the maximum output it could produce if all its factors of production were fully and efficiently employed. It is shown by an outward shift of the production possibility frontier (PPF), or a rightward shift of long-run aggregate supply (LRAS).
Short-run growth is actual growth, which can come from using spare capacity. Long-run growth is potential growth, which sets the trend rate of growth of real national output over time.
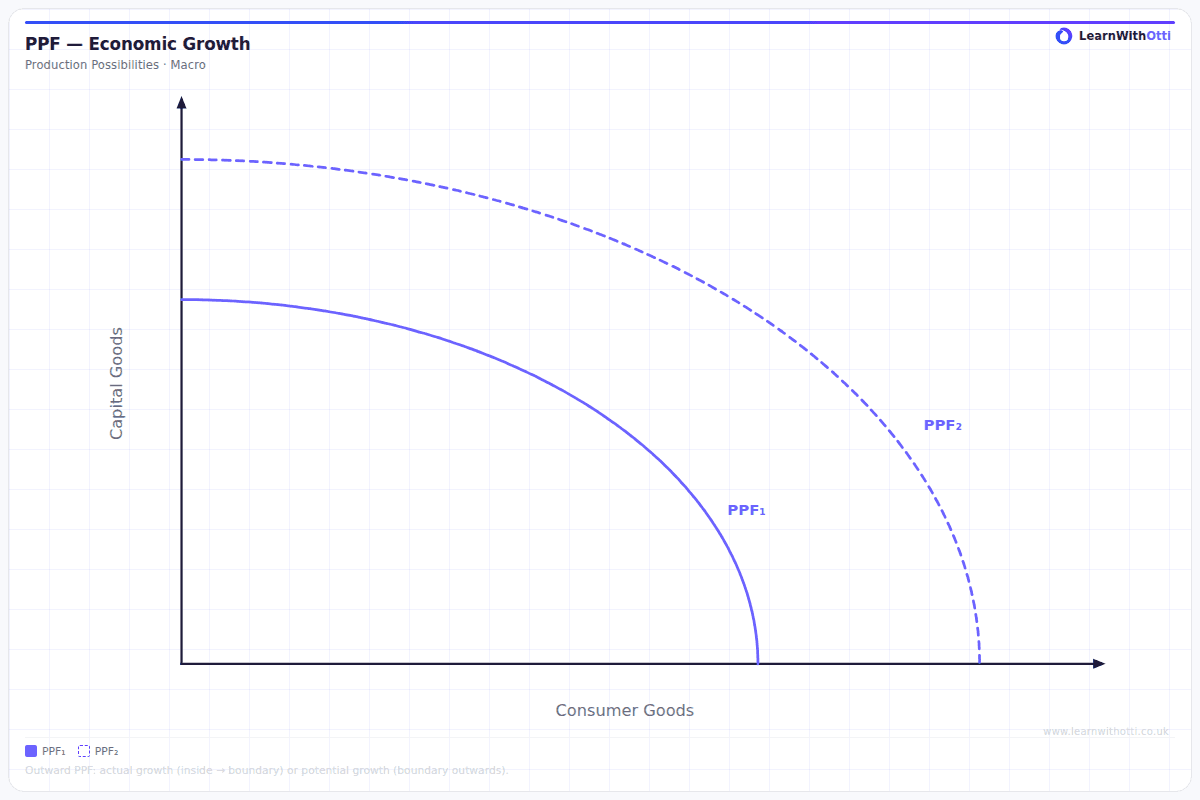
The two can happen separately.
- Actual growth without potential growth. An economy coming out of a recession, with unemployed workers and idle factories, can grow quickly by putting those resources back to work.
- Potential growth without actual growth. New technology or a larger workforce can raise productive capacity, but if spending is weak, the extra capacity sits unused.
Watch out: On a PPF this is a movement from a point inside the frontier towards the frontier itself. Capacity has not changed.
Key idea: The distinction matters because actual growth that comes from using spare capacity eventually runs out. Once the economy reaches full capacity, further increases in demand mainly raise the price level. Sustained growth over the long run needs potential growth.
Actual growth and trend growth
The actual growth rate is the percentage change in real GDP from one period to the next. It moves around a great deal: strong in some years, weak or negative in others.
The trend growth rate is the average rate at which the economy's productive capacity grows over the long term. It reflects the steady growth in the labour force, capital, technology and productivity, so it changes only slowly.
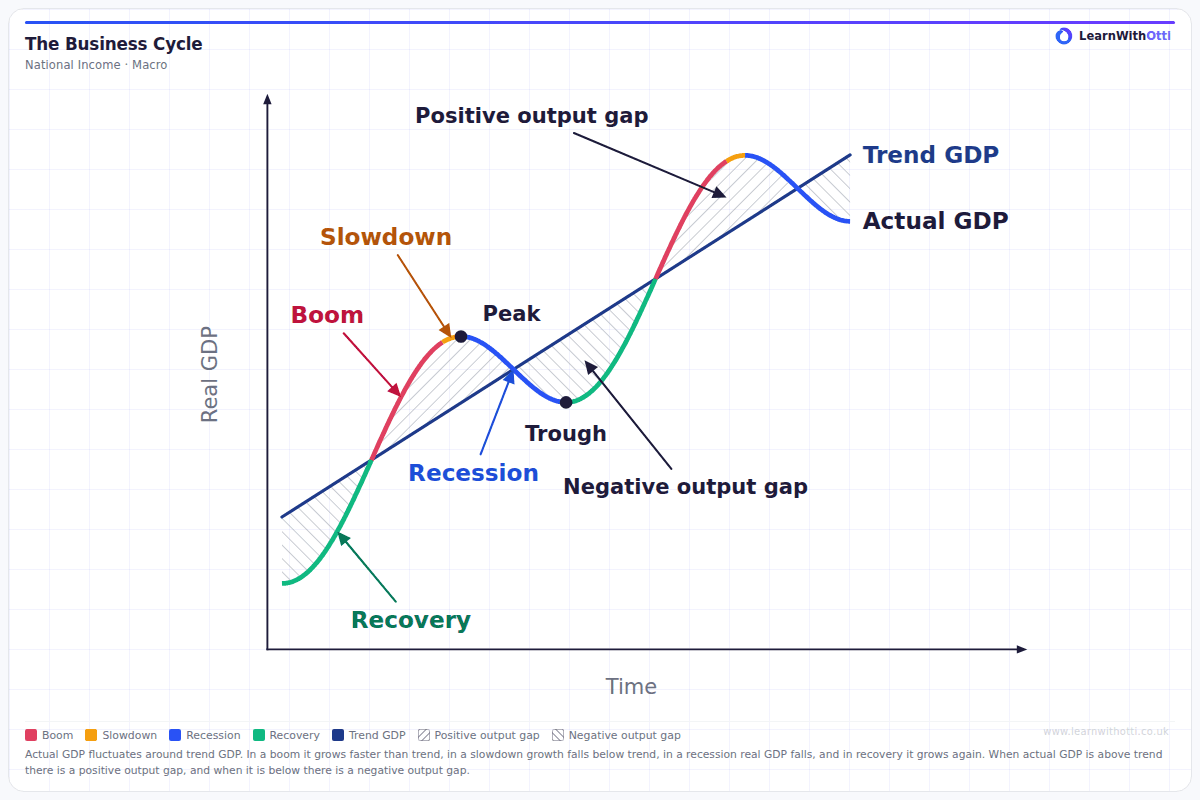
On the diagram, the navy line shows trend GDP, the economy's potential output growing over time. The coloured line shows actual GDP, rising above and falling below the trend. The hatched areas are the output gaps: positive where actual GDP is above trend, negative where it is below. In the UK, trend growth was usually put at around 2.5% a year in the decades before the 2008 financial crisis, and estimates since then have been noticeably lower, reflecting weak growth in productivity.
Key distinction: When actual growth is faster than trend growth, the economy is using up its spare capacity. When actual growth is slower than trend growth, spare capacity is building up, even if the economy is still growing.
Factors which could cause economic growth
Demand-side causes of actual growth
An increase in any component of aggregate demand (AD) can raise real output, as long as there is spare capacity:
- Consumption, for example when households become more confident or interest rates fall.
- Investment, for example when firms expect higher future sales.
- Government Expenditure, for example on public services or infrastructure.
- Net trade, for example when demand for UK exports from foreign consumers rises.
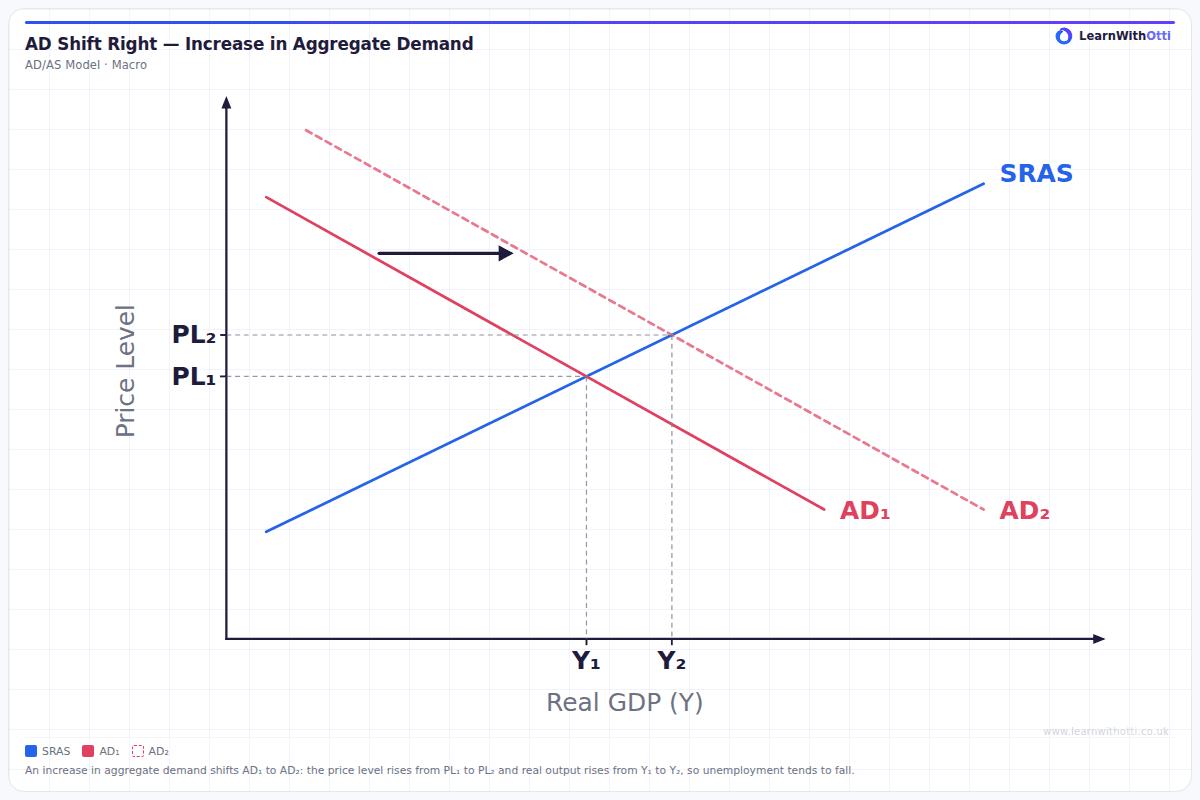
A rise in AD increases real output and the price level. When there is plenty of spare capacity, most of the effect is on output rather than prices. Through the multiplier, the final rise in national income is larger than the initial increase in spending.
Supply-side causes of potential growth
Potential growth comes from an increase in the quantity or quality of the factors of production.
- More labour. A growing population, net inward migration of working-age people and higher participation in the labour force all increase the number of workers.
- Better-quality labour. Education, training and better health raise productivity, the output per worker. This is investment in human capital.
- More and better capital. Investment in machinery, buildings and infrastructure, such as transport and broadband networks, allows each worker to produce more.
- Technology and innovation. New products and new methods of production allow more output from the same inputs. Advances in computing, automation and artificial intelligence are recent examples.
- Enterprise. Entrepreneurs who start firms and bring new ideas to market raise the economy's capacity, so policies that encourage enterprise can support growth.
- Natural resources. The discovery of new resources raises capacity. The development of North Sea oil and gas from the 1970s added to UK productive capacity.
- Efficiency of markets. Stronger competition and less unnecessary regulation encourage firms to cut costs and innovate.
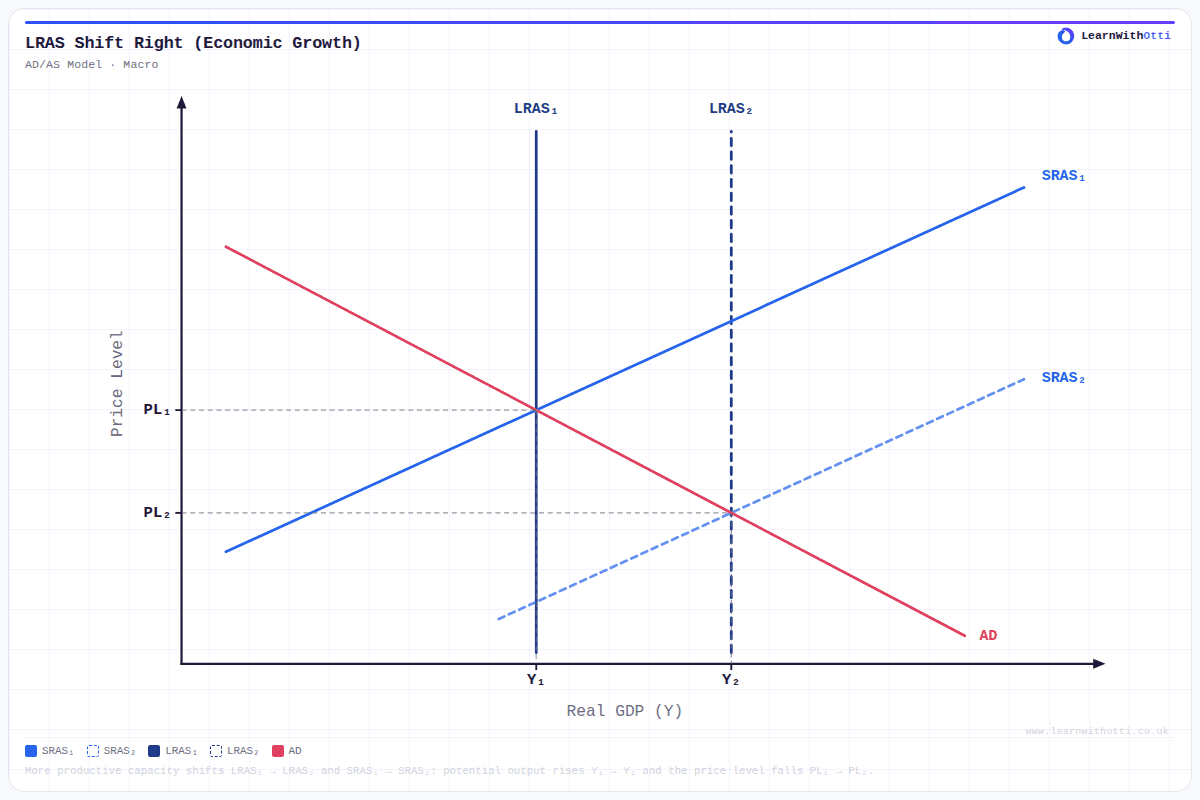
Key idea: Investment does two jobs. Spending on new capital is a component of AD, so it raises actual growth in the short run. It also adds to the capital stock, so it shifts LRAS to the right and raises potential growth in the long run.
This is why low investment is often seen as a weakness in an economy's growth prospects.
The importance of international trade for export-led growth
Export-led growth happens when rising exports are the main driver of an increase in real GDP.
International trade can boost growth in several ways:
- Exports are an injection. Spending by foreign consumers and firms on UK goods and services adds to AD through net trade, and the multiplier increases the final effect on national income.
- Larger markets. Selling to the rest of the world lets firms grow beyond the size of the domestic market, so they benefit from economies of scale and lower average costs.
- Specialisation. Trade lets countries specialise in what they produce most efficiently, raising total output.
- Competition. Exposure to foreign competition pushes domestic firms to become more efficient and to innovate.
- Access to imports and investment. Trade gives firms access to cheaper raw materials, components and capital goods, and it attracts inward investment by multinational firms, which can bring new technology and skills.
China's rapid growth from the late 1970s onwards was driven to a large extent by manufactured exports, and Germany has long relied on exports of cars and machinery. The UK's exports are dominated by services, such as financial, professional and business services.
Limits of export-led growth
- Dependence on other economies. If major trading partners go into recession, demand for exports falls. The global financial crisis of 2008 to 2009 caused a sharp fall in world trade.
- Exchange rates. A rise in the value of the currency makes exports more expensive for foreign consumers and can weaken export growth.
- Protectionism. Tariffs and other trade barriers imposed by other countries reduce access to export markets.
- Imbalances. Export-led growth in one country means rising imports somewhere else, which can lead to trade tensions.
The costs and benefits of economic growth
Consumers
Benefits
- Higher real incomes. When real GDP grows faster than the population, real GDP per capita rises. Firms produce more, so they pay out more in wages, rent, interest and profit, and on average people can afford to buy more goods and services. Because the figure is real, this is a genuine rise in purchasing power, not just higher prices.
- More jobs and greater job security. Labour is a derived demand: firms need more workers to produce the extra output. Unemployment falls, people who were out of work gain an income, and workers already in jobs face less risk of being laid off, which makes them more confident about spending and borrowing.
- More choice and better quality. Growing markets give firms the revenue and the incentive to develop new products and improve existing ones, because higher demand means a better return on research and development. Consumers gain from products such as new medicines and digital services that did not exist before.
- Better public services. As incomes and spending rise, the government collects more tax without raising tax rates. This can pay for more spending on health, education and transport, which consumers use whether or not their own income has risen.
Costs
- Inflation. If growth comes mainly from aggregate demand rising faster than productive capacity, firms run short of workers and materials and raise prices. Real incomes are eroded, and people on fixed incomes, such as some pensioners and benefit claimants, lose most because their income does not rise with prices.
- Uneven gains. Growth is usually concentrated in particular industries and regions. Workers with skills in demand see their wages rise fastest, while those in declining industries or poorer regions may gain little, so inequality can widen even while average incomes rise.
- Negative externalities. More production uses more energy and raw materials, and higher incomes mean more cars, flights and consumption. This creates pollution, congestion and noise, which harm third parties and are not reflected in market prices.
- Longer hours and stress. Some of the extra output may come from people working longer hours or more intensively rather than more productively. Measured income rises, but leisure time falls, so wellbeing may not improve as much as GDP suggests.
Firms
Benefits
- Higher sales and profits. Rising real incomes increase demand for normal goods, especially luxuries, whose demand is income elastic. Higher sales spread fixed costs over more units, so profits usually rise faster than sales.
- More investment. Higher profits provide internal finance for investment, and confidence that demand will keep rising makes new capacity look worthwhile. This is the accelerator effect: firms invest when they expect output to grow. The extra capital also adds to the productive capacity of the economy.
- Economies of scale. As firms grow, they can buy in bulk, use specialised machinery and spread fixed costs over a larger output. Their long-run average costs fall, which can be passed on as lower prices or kept as higher profit.
- Lower risk. When demand is growing, firms are less likely to be left with unsold stock or unable to cover their costs, so fewer businesses fail and it is easier to raise finance from banks and investors.
Costs
- Rising costs. Fast growth means many firms want more workers and materials at the same time. Shortages of skilled labour push up wages, and higher demand for raw materials and components pushes up their prices, which squeezes profit margins.
- Capacity constraints. In the short run, firms cannot expand capacity quickly. If they cannot meet orders, customers may turn to competitors, including foreign firms, so sales are lost to imports.
- Weaker international competitiveness. If growth pushes UK inflation above that of other countries, UK goods become relatively more expensive abroad and imports become relatively cheaper at home, so exporters and firms competing with imports lose sales.
- Uneven effects. Not every firm gains. Demand for inferior goods, such as some value or budget products, falls as incomes rise, because consumers switch to better alternatives.
The government
Benefits
- Higher tax revenue without higher tax rates. Income tax receipts rise as incomes rise, VAT receipts rise as spending rises, and corporation tax receipts rise as profits rise. With a progressive income tax, revenue can rise faster than incomes, as more income is taxed at higher rates.
- Lower spending on welfare benefits. As unemployment falls, fewer people claim unemployment-related benefits, and rising wages reduce the number who qualify for in-work support.
- Improving public finances. Higher revenue and lower welfare spending reduce the budget deficit. Government debt also falls as a percentage of GDP, both because less is borrowed and because GDP itself is larger.
- More room for spending or tax cuts. The extra revenue can pay for public services and infrastructure, or allow tax cuts, without extra borrowing. This makes it easier for the government to meet its fiscal rules.
Costs
- Inflationary pressure. If growth is above the trend rate and the economy runs out of spare capacity, inflation rises. The Bank of England may raise interest rates, and the government may need to tighten fiscal policy, which can slow growth sharply.
- A worsening current account. Rising incomes increase spending on imports, especially when domestic firms are already at full capacity. If exports do not rise as fast, the current account deficit widens.
- Pressure on infrastructure and public services. A larger economy and a growing population put more strain on housing, transport, schools and health care. The government must spend more just to keep services at the same standard.
- Environmental costs. Growth can increase pollution and carbon emissions, which the market does not correct on its own. The government may need taxes, regulation or spending to deal with these negative externalities, and to meet commitments such as net zero by 2050.
Current and future living standards
Current living standards
Growth in real GDP per capita raises the average person's material standard of living. But how much it improves wellbeing depends on:
- distribution: who receives the extra income
- what is produced: more spending on clean-up after pollution adds to GDP without making anyone better off
- the costs that GDP misses: pollution, congestion and lost leisure time
Future living standards
Growth affects the future as well as the present.
- Investment raises future capacity. Growth that comes from investment in capital, infrastructure, education and technology increases productive capacity, so future generations can enjoy higher living standards.
- There is an opportunity cost. Resources used to produce capital goods today cannot be used to produce consumer goods. On a production possibility frontier, choosing more capital goods now means less consumption now, but a larger outward shift of the frontier later.
- Resource depletion and environmental damage. Growth that uses up non-renewable resources, or damages the environment through pollution and climate change, can reduce the living standards of future generations.
Key idea: Growth that meets the needs of the present without reducing the ability of future generations to meet their own needs is called sustainable growth.
It depends on the type of growth
Evaluation: The balance of benefits and costs depends on where the growth comes from. Growth driven by rising aggregate demand alone uses up spare capacity and, once the economy is close to full capacity, mainly pushes up prices. Growth driven by an increase in productive capacity raises output without the same inflationary pressure, so its benefits are more likely to last and to outweigh its costs.
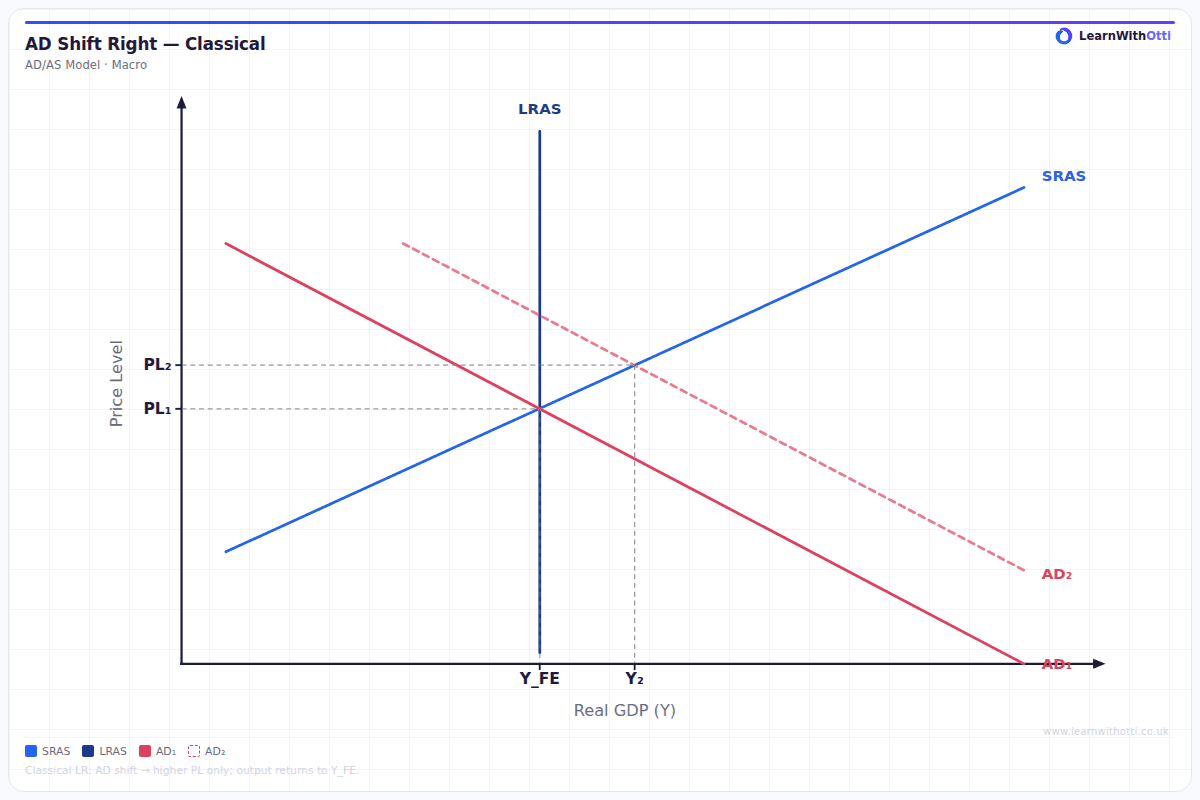
Demand-led growth close to full capacity. If AD rises when the economy is already at full capacity, the result is mainly a higher price level. Growth like this is unlikely to last and tends to bring inflation and a worsening current account.
Supply-led growth. If growth comes from an increase in LRAS, through better technology, more investment or a more skilled workforce, real output can rise without rising inflation. This kind of growth is more likely to be sustained, and its benefits are more likely to outweigh its costs.
Other factors also shape the impact: how evenly the gains are shared, how much environmental damage the growth causes, and whether the growth rate is steady or swings between boom and recession.
The economic cycle
The trade (business) cycle, or economic cycle, is the pattern of fluctuations in actual real GDP around the economy's long-term trend rate of growth.
The cycle has four phases. Each one leads into the next for a reason.
- Boom. Real GDP grows faster than its trend rate and output rises above trend, so there is a positive output gap. Confidence is high, so households spend more and firms invest to meet rising sales. Through the multiplier, each rise in spending creates further income and further spending. As spare capacity is used up, firms compete for scarce workers and materials, so costs and prices start to rise.
- Slowdown (downturn). Growth is still positive but starts to fall. Rising costs squeeze profits, and higher inflation leads the Bank of England to raise interest rates, which makes borrowing more expensive. Households cut back on spending paid for by credit, and investment slows as firms decide they have enough capacity. Output is still above trend, but the positive output gap starts to close.
- Recession. Real GDP falls for at least two consecutive quarters, which is two quarters of negative economic growth. Firms facing weaker demand cut output and jobs, and the multiplier works in reverse: workers who lose their jobs spend less, which reduces sales for other firms. Falling confidence makes households save more and firms postpone investment. Output falls below trend and a negative output gap opens. The lowest point of the cycle is the trough.
- Recovery (upturn). Real GDP starts to grow again, but output is still below trend. Lower interest rates, lower costs and the need to replace worn-out machinery, cars and household goods encourage spending to pick up. Firms can use their spare capacity first, so output can rise quickly without much inflation. As confidence returns, the economy moves back towards trend and the cycle begins again.
The cycle is not regular. Diagrams draw it as a smooth, even wave so the phases are easy to see, but in reality booms and recessions vary in length and depth, and there is no fixed number of years between one peak and the next.
Identifying the phases. A range of indicators shows where the economy is in the cycle: the growth rate of real GDP, the rate of inflation, the level of unemployment and the level of investment. In a boom, growth, inflation and investment are high and unemployment is falling. In a recession, the reverse is true.
What drives the cycle
Key idea: Most fluctuations come from changes in aggregate demand (AD), which the multiplier then amplifies. A small change in spending can therefore lead to a much larger change in real GDP.
- Confidence. When households and firms are optimistic about future incomes and sales, consumption and investment rise. Higher spending raises incomes and sales, which makes people more confident still, so optimism can feed on itself. Keynes called these swings in mood animal spirits: decisions to spend and invest are driven partly by emotion and gut feeling, not just by careful calculation. When confidence falls, households save more and firms postpone investment, and the same process works in reverse.
- Interest rates and credit. Cheap and easily available credit lowers the cost of borrowing, so households borrow to buy houses, cars and other consumer durables, and firms borrow to invest. Higher interest rates raise the cost of new borrowing and of existing mortgage payments, which leaves households with less to spend. Changes in interest rates take time to affect spending, so their full effect may not be felt for a year or more.
- Asset prices. Rising house and share prices increase household wealth, so people feel better off and are more willing to spend, even if their income has not changed. This is the wealth effect. Rising house prices also let homeowners borrow more against the value of their homes. When asset prices fall, the effects reverse, and households may cut spending sharply to rebuild their savings.
- The world economy. A downturn in major trading partners such as the EU or the USA reduces their demand for UK exports. Lower exports reduce AD directly, and then reduce it further through the multiplier as exporting firms cut output and jobs. In this way a recession can spread from one country to another, as it did in 2008 and 2009.
- Supply shocks. A sharp rise in the price of oil or gas raises firms' costs of production, which shifts short-run aggregate supply (SRAS) to the left. The economy then faces higher inflation and lower real output at the same time. Higher energy bills also leave households with less to spend on other goods and services, which reduces AD as well. The rise in energy prices in 2022 is an example.
- Debt, bubbles and herding. When credit grows too fast, households and firms build up debts that become hard to repay once the economy slows. When asset prices have been rising, investors may buy simply because they expect prices to keep rising. Others copy them, which is known as herding. This destabilising speculation pushes prices far above their underlying value until confidence breaks and the bubble bursts.
Characteristics of a boom
In a boom, actual growth is above trend and the economy is running close to, or beyond, its capacity.
- High growth in real GDP and a positive output gap. Actual output rises above its trend level as firms produce more than they could sustain in the long run, for example by paying overtime and running machinery for longer.
- Falling unemployment. Firms recruit more workers to meet rising demand, so cyclical unemployment falls. As the pool of unemployed workers shrinks, firms struggle to find people with the right skills, and skill shortages appear.
- Rising wages and costs. With fewer workers available, firms compete for them by offering higher wages. Demand for raw materials and components also rises, so their prices increase. Together, higher wages and input prices raise firms' costs of production.
- Rising inflation. Demand-pull inflation occurs because AD is growing faster than the economy's capacity to produce. Cost-push inflation follows as firms pass on higher wages and input costs as higher prices. Workers may then demand further pay rises to protect their real wages, which can lead to a wage-price spiral.
- High consumer and business confidence. Rising incomes and job security make households more willing to spend and borrow, so consumption grows strongly. Firms that expect sales to keep rising invest in new capacity, which adds further to AD through the multiplier.
- Rising asset prices, such as house and share prices. Strong demand for houses, together with easy credit, pushes up house prices, and rising company profits push up share prices. Higher asset prices increase wealth and confidence, which encourages even more spending through the wealth effect.
- Improving public finances. Tax revenues rise automatically as incomes, spending and profits rise, so the government collects more income tax, VAT and corporation tax. At the same time, spending on unemployment benefits falls as more people find work. The budget deficit therefore shrinks, or a surplus may appear. These automatic stabilisers take spending power out of the economy and help to slow the boom down.
- A worsening current account. When their incomes rise, UK consumers buy more goods and services from abroad, so spending on imports grows. Rising inflation can also make UK exports less price competitive. With imports growing faster than exports, the current account deficit tends to widen.
The UK in the late 1980s is a classic example. Strong growth in consumer spending and house prices was followed by inflation rising to around 10% by 1990.
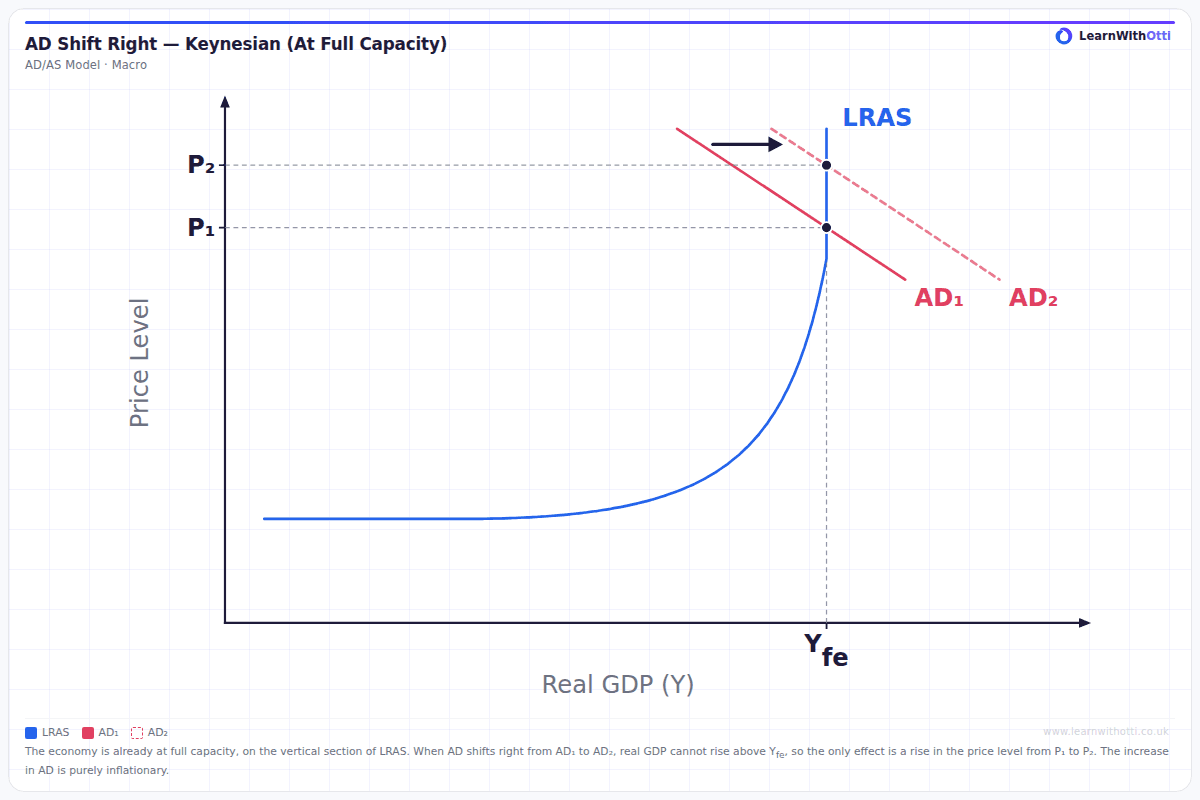
When AD keeps rising once the economy is already at full capacity, real GDP cannot rise any further. The increase in AD only pushes up the price level, so the result is demand-pull inflation with no extra output.
Characteristics of a recession
A recession is commonly defined in the UK as two consecutive quarters of negative growth in real GDP.
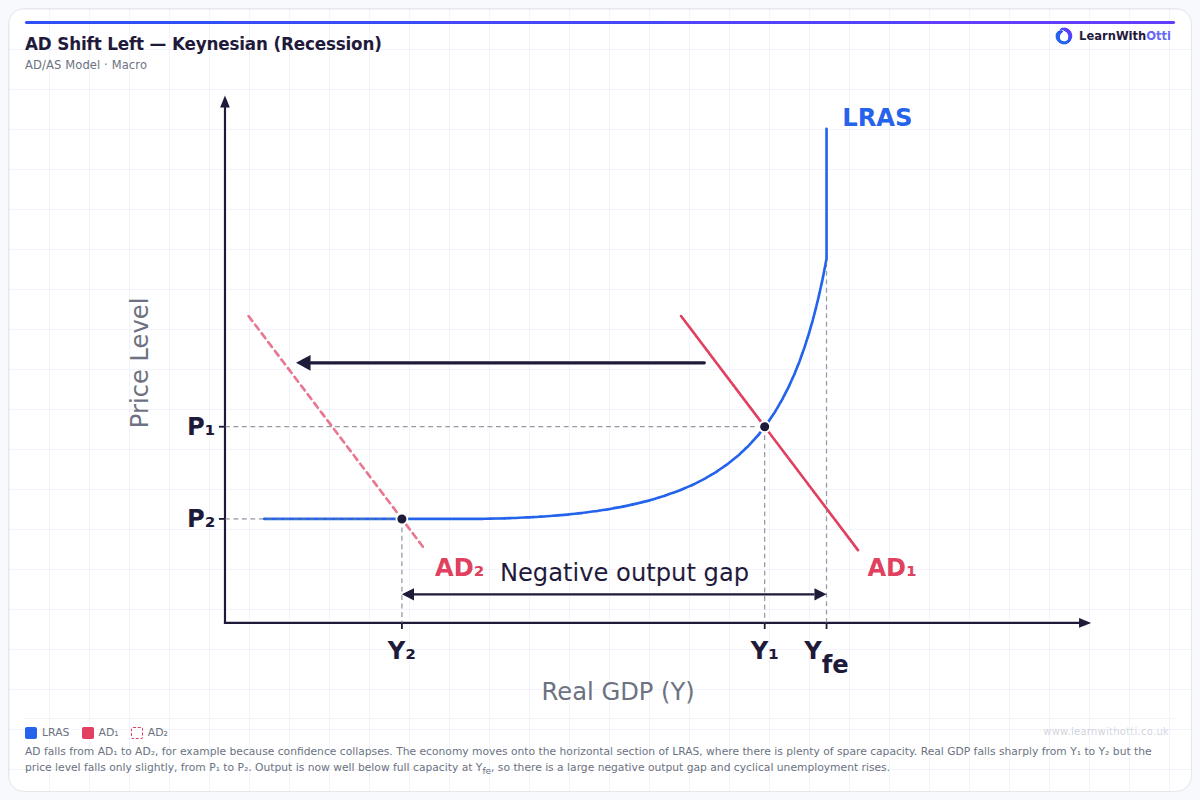
When AD falls and the economy moves onto the horizontal section of LRAS, real GDP falls sharply but the price level falls only slightly, because there is now plenty of spare capacity. Output is well below full capacity, so a large negative output gap opens up.
- Falling real output and a negative output gap. As AD falls, firms cut production to avoid building up unsold stock. Through the multiplier, each cut in spending reduces other people's incomes, so output falls by more than the first drop in demand. Actual output falls below its trend level, leaving workers and machinery idle.
- Rising unemployment, especially cyclical unemployment. Labour is a derived demand, so when firms produce less they need fewer workers. Firms usually cut overtime and stop recruiting first, then make workers redundant. Young people leaving education find it harder to get a first job.
- Falling inflation, and occasionally deflation. With weak demand and spare capacity, firms cut prices or offer discounts to win sales, and workers are in a weak position to push for pay rises. Slower wage growth keeps firms' costs down, so cost-push pressure eases as well. If the price level actually falls, there is deflation.
- Low consumer and business confidence. Fear of losing their jobs makes households save more and delay buying big items such as cars and furniture. Firms that expect sales to stay weak postpone investment, because they already have spare capacity. Lower spending reduces AD further, which can deepen the recession.
- Business failures, as sales and profits fall. Firms with high debts or thin profit margins may be unable to pay their bills, especially if banks become less willing to lend. Each failure means lost jobs and lost orders for suppliers, which spreads the damage to other firms.
- Worsening public finances. Tax revenues fall automatically because incomes, spending and profits are lower, so the government collects less income tax, VAT and corporation tax. At the same time, spending on unemployment and other welfare benefits rises. The budget deficit widens and government borrowing increases. These automatic stabilisers support AD and help to cushion the recession.
- An improving current account. Lower incomes mean households spend less on imports. If UK inflation falls below that of other countries, UK exports may also become more price competitive. The current account deficit therefore tends to narrow, although weak demand abroad can reduce exports too.
The UK went into recession in 2008 to 2009 after the global financial crisis, and in 2020, when restrictions during the coronavirus pandemic caused the largest annual fall in output for around three centuries.
Recession, slowdown and recovery
Key distinction: A slowdown is not a recession. If growth falls from 3% to 1%, output is still rising. A recession means output is actually falling, and it is usually defined as two consecutive quarters of negative economic growth.
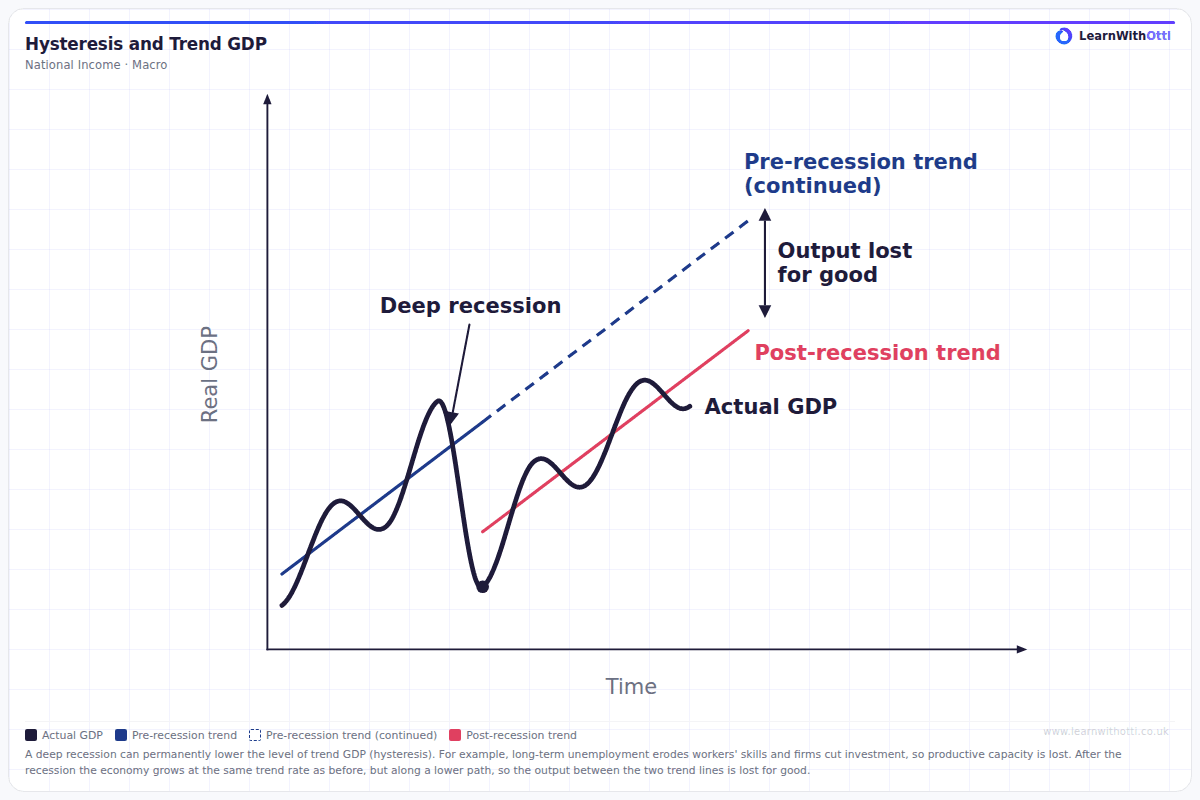
Recovery can be slow. Unemployment often keeps rising for some time after output starts to grow, because firms wait to be sure that demand has returned before they recruit. A deep recession can also cause lasting damage. This is called hysteresis: a fall in AD that lasts long enough reduces the economy's productive capacity, so the effects of the recession continue even after demand has recovered. Workers who are unemployed for a long time lose skills, confidence and contacts with employers, so they find it harder to get back into work, and some leave the labour force altogether. Investment that was postponed during the recession is never made, so the capital stock is smaller than it would otherwise have been. As a result, trend GDP grows at the same rate as before but from a lower level, and the output lost in the recession is never recovered.
Output gaps
An output gap is the difference between actual output and potential output. It is usually expressed as a percentage of potential output.
Negative output gap
A negative output gap exists when actual output is below potential output. The economy has spare capacity.
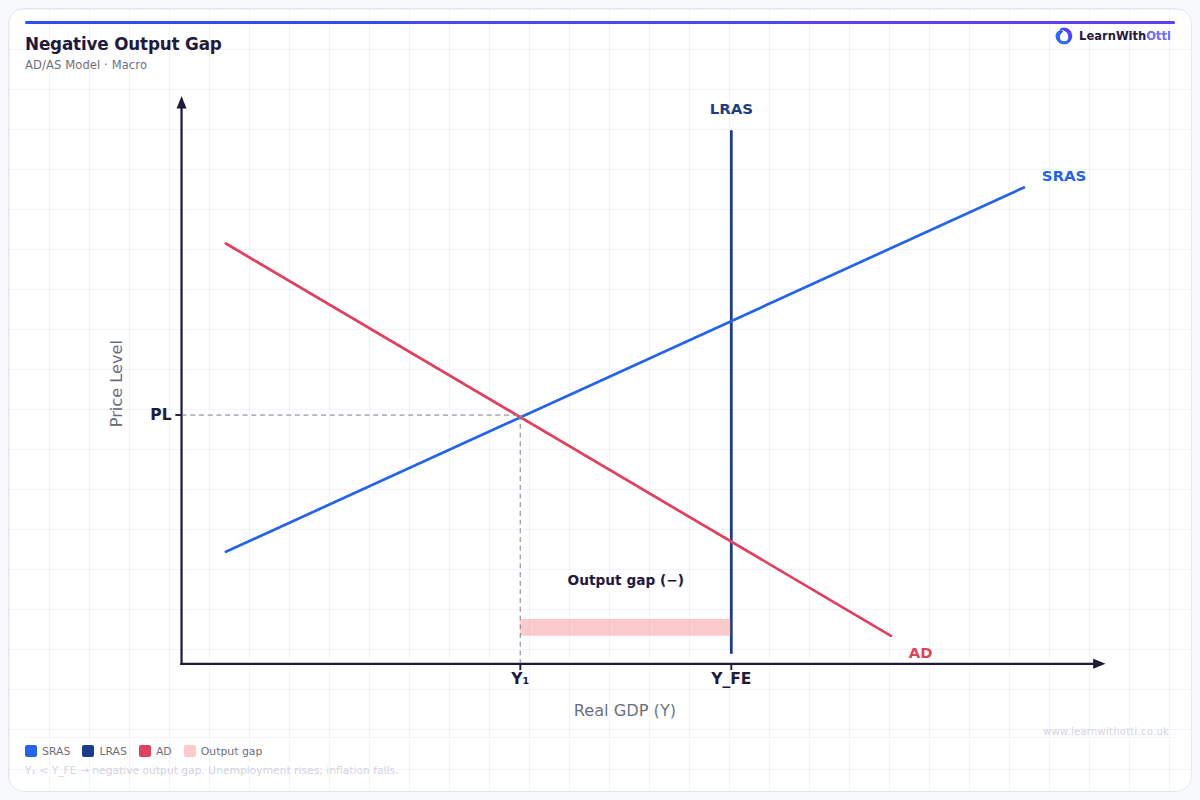
- Unemployment is above its normal level, because firms need fewer workers.
- Factories and offices are under-used, so firms have little reason to invest in more capacity.
- Inflationary pressure is weak. With spare workers and capacity, firms find it hard to raise prices and workers find it hard to win pay rises.
A large negative output gap is typical of a recession.
Positive output gap
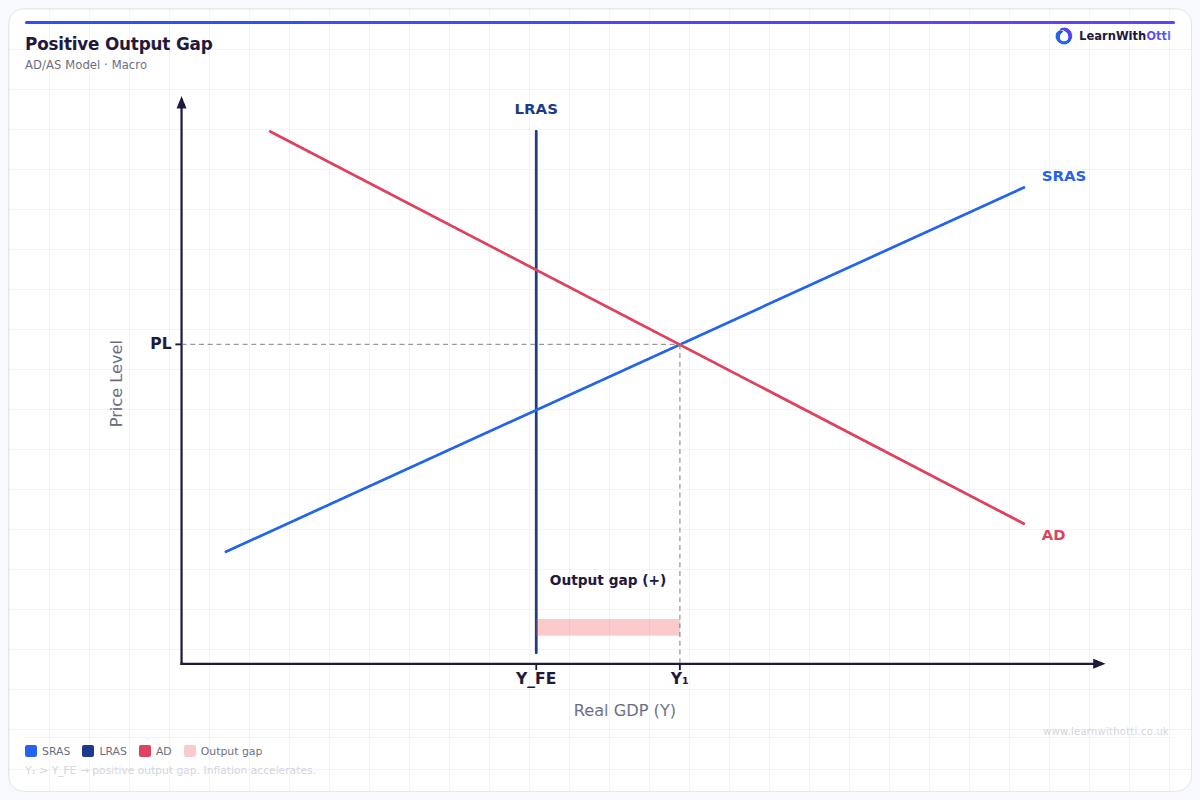
A positive output gap exists when actual output is above potential output. The economy is producing more than it can sustain.
Watch out: This can seem impossible, but potential output is the level the economy can sustain without rising inflation, not an absolute physical maximum.
For a while, firms can produce more by:
- paying workers overtime and recruiting people who would not normally be in work
- running machinery for longer and delaying maintenance
- drawing down stocks of finished goods
The result is shortages of labour and materials, rising wages and costs, and inflationary pressure. A positive output gap cannot last, because workers tire and machinery wears out. It is typical of a boom.
Showing an output gap on an AD/AS diagram
An AD/AS diagram shows the output gap as the horizontal distance between equilibrium real output and the full-capacity level of output.
- Classical diagram. LRAS is vertical at the full-capacity level of output (Yfe). If AD and short-run aggregate supply (SRAS) intersect to the left of LRAS, real output is below Yfe and there is a negative output gap equal to the distance from equilibrium output to Yfe. If they intersect to the right of LRAS, there is a positive output gap.
- Keynesian diagram. If AD cuts the AS curve on its horizontal or upward-sloping section, the economy is operating below full capacity. The distance from equilibrium output to the vertical section of the curve shows the level of spare capacity.
Label both axes (price level and real output), the equilibrium output and the full-capacity level of output, and mark the gap between them clearly.
The difficulties of measuring output gaps
Actual output can be measured, if imperfectly. Potential output cannot be observed at all, so it has to be estimated. This creates several problems.
- Potential output is an estimate. It is calculated using statistical techniques and business surveys about spare capacity and recruitment difficulties. Different methods give different answers.
- GDP figures are revised. Early estimates of real GDP are often revised months or years later, so the measured gap changes after the event.
- Trend growth changes. After the 2008 financial crisis, productivity growth in the UK slowed sharply. Estimates made at the time assumed the old trend would return, so the negative output gap was thought to be larger than it later turned out to be.
- Structural change. Shocks such as the coronavirus pandemic, changes in migration or new technology change the economy's capacity in ways that are hard to measure quickly.
- Different organisations disagree. The Office for Budget Responsibility, the Bank of England and international bodies publish their own estimates, which can differ in size and even in sign.
Evaluation: These difficulties matter for policy. If policymakers believe there is a negative output gap when there is not, they may stimulate demand and cause inflation. If they underestimate spare capacity, they may hold the economy back unnecessarily.
Key terms
| Term | Meaning |
|---|---|
| Actual growth | An increase in real GDP |
| Potential growth | An increase in the economy's productive capacity |
| Productive capacity | The maximum output an economy can produce with its resources fully and efficiently employed |
| Trend growth rate | The average long-term rate of growth of productive capacity |
| Productivity | Output per worker or per hour worked |
| Human capital | The skills, knowledge and experience of the workforce |
| Export-led growth | Growth in real GDP driven mainly by rising exports |
| Sustainable growth | Growth that meets present needs without reducing the ability of future generations to meet theirs |
| Negative externality | A cost of production or consumption borne by a third party |
| Trade (business) cycle | Fluctuations in actual real GDP around its long-term trend |
| Boom | A period of fast growth with output above trend |
| Downturn | A period in which growth slows |
| Recession | Two consecutive quarters of negative growth in real GDP |
| Recovery | A period in which growth resumes after a recession |
| Hysteresis | When a deep recession permanently reduces productive capacity, so trend GDP continues from a lower level |
| Herding | Investors copying the buying or selling decisions of others rather than judging value for themselves |
| Potential output | The level of output the economy can sustain without rising inflation |
| Output gap | The difference between actual and potential output, as a percentage of potential output |
| Negative output gap | Actual output below potential output, so there is spare capacity |
| Positive output gap | Actual output above potential output, so the economy is overheating |
| Spare capacity | Unused factors of production that could be brought into use |
Common mistakes
- Using "growth" without saying which kind. Make clear whether you mean actual growth (more output) or potential growth (more capacity).
- Shifting the PPF outward for a fall in unemployment. Putting unemployed resources to work is a movement towards the PPF, not a shift of it.
- Treating any rise in AD as long-run growth. A rise in AD raises real output only if there is spare capacity. Sustained growth needs LRAS to shift right.
- Forgetting that investment affects both AD and LRAS.
- Listing benefits and costs without saying who is affected. Make clear whether you are discussing consumers, firms or the government.
- Ignoring the type of growth. Demand-led growth at full capacity and supply-led growth have very different effects on inflation and sustainability.
- Treating a slowdown as a recession. Slower growth is still growth. A recession needs real output to fall.
- Drawing a regular cycle. Real cycles vary in length and depth.
- Mixing up the cycle and the trend. The cycle is the fluctuation around trend, while the trend reflects growth in productive capacity.
- Confusing slower growth with a negative output gap. An economy can be growing and still have a widening negative output gap, if actual growth is below trend growth.
- Measuring the gap vertically on an AD/AS diagram. The output gap is a gap in real output, so it is a horizontal distance.
- Treating output gap figures as precise. They are estimates, and they are often revised.
How this has been examined
In the AQA papers indexed on this site, this topic has appeared in seven formats:
- 25-mark "Assess" essay — asked 3 times across 3 series (2019 to 2024)
- 25-mark "Evaluate" essay — asked once (2023)
- 15-mark "Explain" essay — asked 4 times across 4 series (2017 to 2024)
- 10-mark "To what extent" data response — asked twice across 2 series (2017 to 2025)
- 4-mark "Explain" data response — asked once (2017)
- 2-mark calculation — asked 3 times across 3 series (2017 to 2025)
- 1-mark multiple choice — asked 8 times across 6 series (2017 to 2025)
Where this goes next
How growth is measured using real GDP is covered in 4.2.1.4 Uses of national income data, and the factors that shift LRAS in 4.2.2.6 Determinants of long-run aggregate supply. The links between output gaps, unemployment and inflation are developed in 4.2.3.2 Employment and unemployment, 4.2.3.3 Inflation and deflation and 4.2.3.4 Possible conflicts between macroeconomic policy objectives. Policies to raise potential growth are covered in 4.2.5.2 Supply-side policies, and the effect of the cycle on government borrowing in 4.2.5.1 Fiscal policy. Growth in developing economies is covered in 4.2.6.5 Economic growth and development.
Otti is an AI tutor built for A-Level students. Ask it anything, practise exam questions, and get instant feedback written like an examiner would give it — not just right or wrong, but why.
Get one answer marked free