AQA A-Level Economics · Revision notes
4.1.3.3 The Determinants of the Supply of Goods and Services
Supply shows the quantity producers are willing and able to offer at each price, over a given period. The curve slopes upwards: a higher price makes production more profitable, so more is offered. This page covers why higher prices encourage firms to expand output, the distinction between movements along and shifts of the supply curve, and the causes of those shifts.
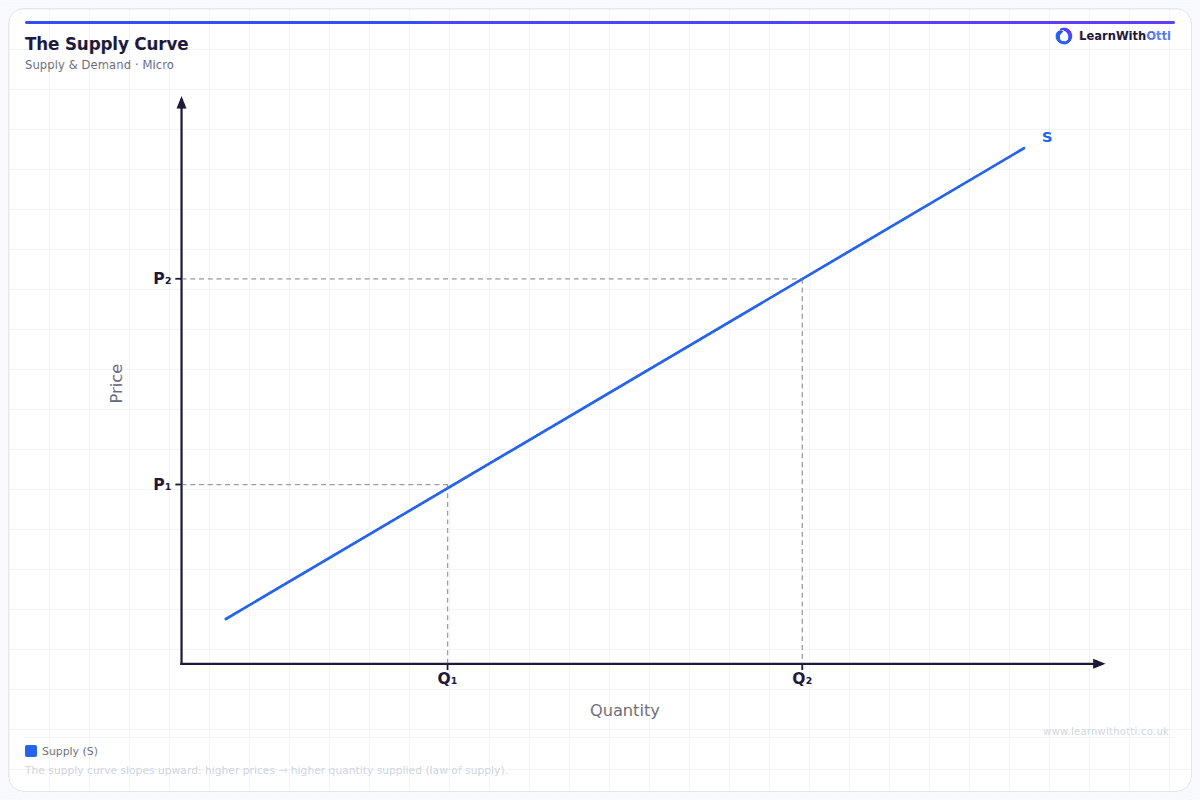
Why higher prices encourage more supply
Higher prices imply higher profits. If costs stay the same, each unit sold at a higher price earns a bigger margin, so existing firms have an incentive to expand production and new firms are attracted into the market. Producing extra output usually costs more per unit in the short run, so firms only supply more when the price rises enough to cover those extra costs.
Movements along versus shifts of the supply curve
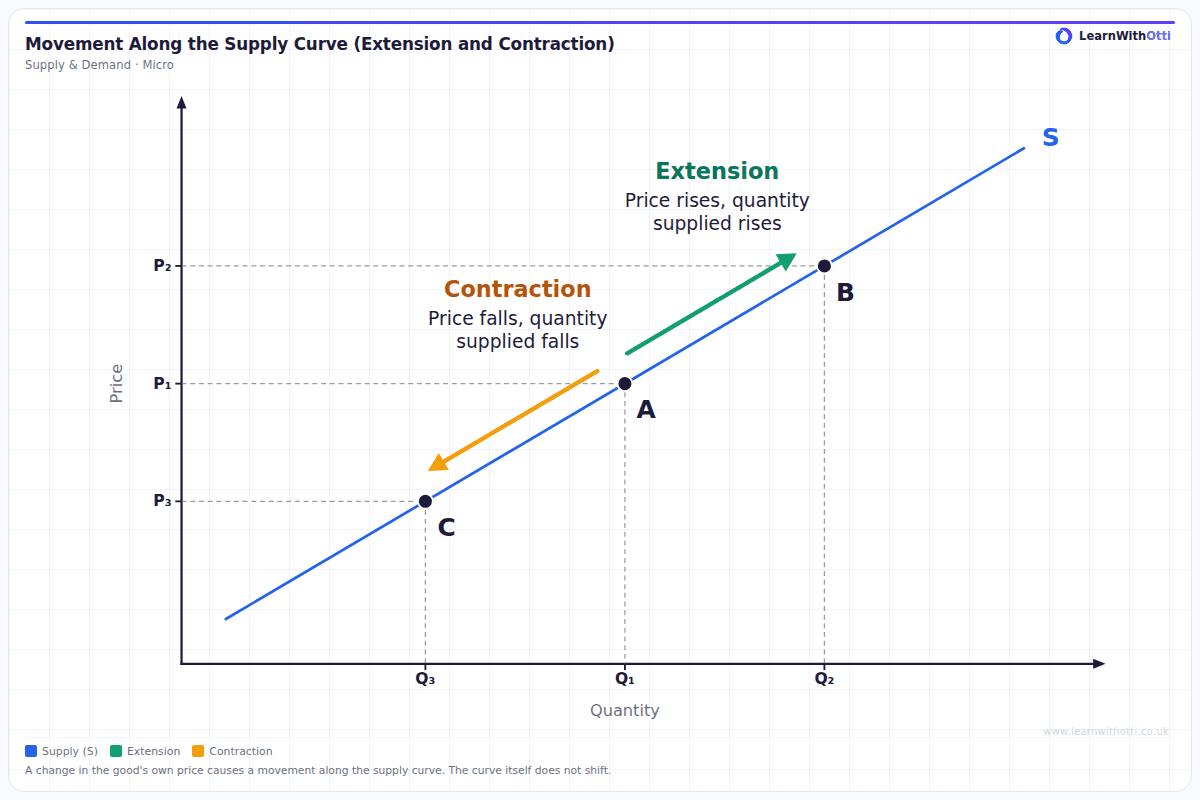
A change in the price of the good itself causes a MOVEMENT ALONG the supply curve.
This is called a change in quantity supplied — more or less of the same curve, at a different point on it. Nothing about the producer's willingness has changed; only the price has.
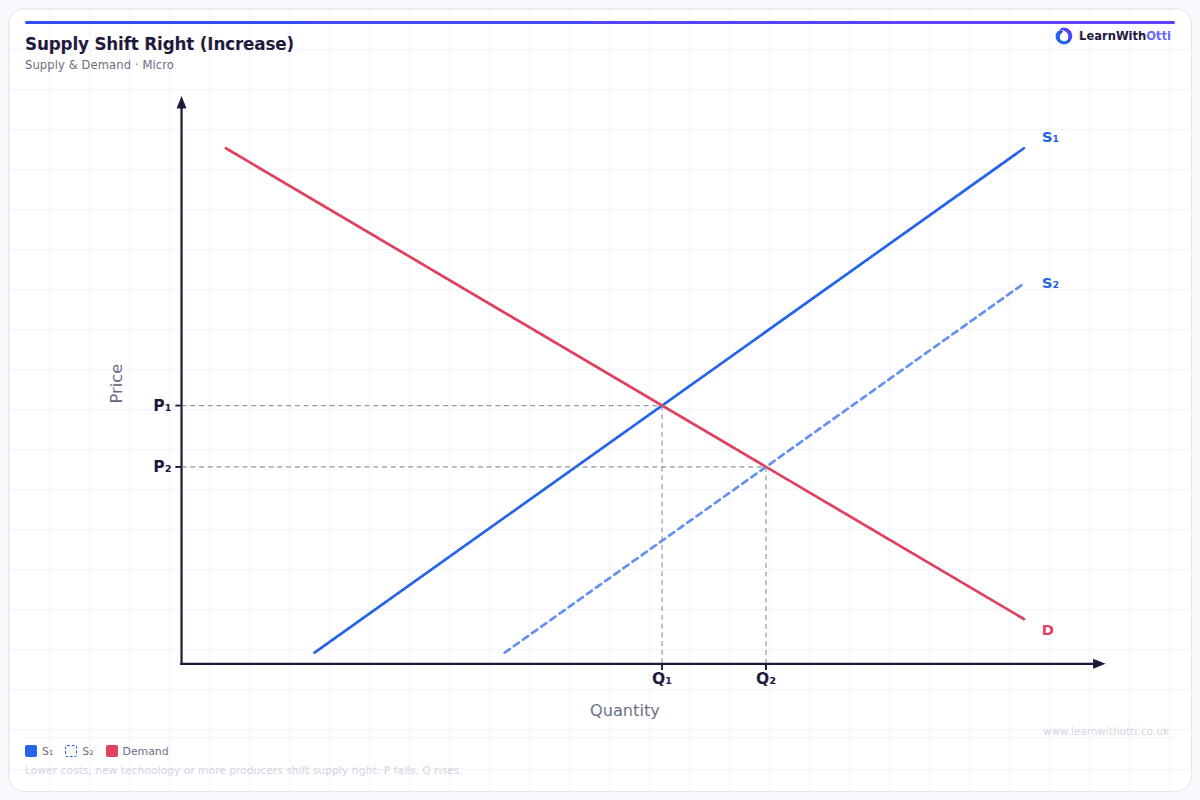
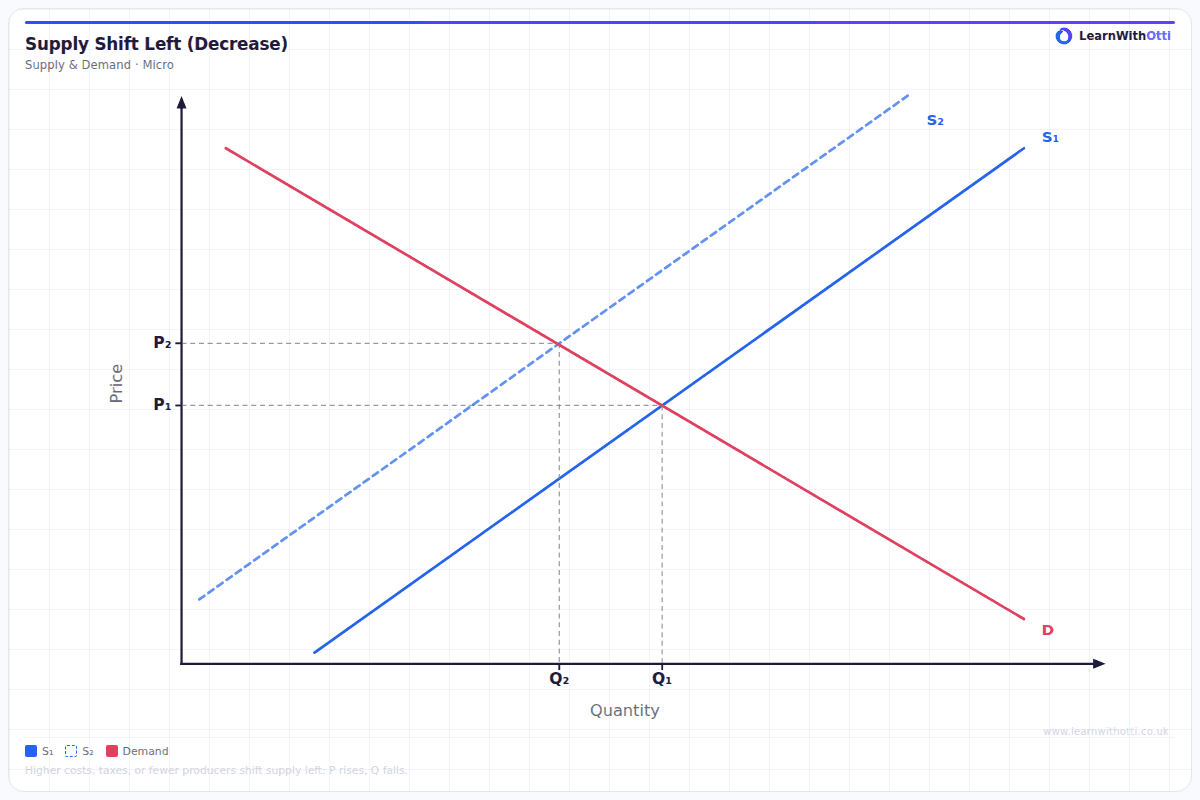
A change in anything else causes a SHIFT of the whole supply curve.
This is called a change in supply. At every possible price, producers now offer a different quantity. The curve moves right (an increase in supply) or left (a decrease).
Why this follows: the supply curve is drawn holding every influence except price constant — the ceteris paribus assumption. Price is the one variable the curve already accounts for, so a price change moves you along it. Any other influence was being held still, so when it changes, the whole curve must be redrawn.
Key distinction: The reliable test: if the cause is the price of this good, move along. If it is anything else, shift.
Two pieces of vocabulary follow from this, and they are worth being precise about:
- Change in quantity supplied = movement along, caused by price.
- Change in supply = shift, caused by anything else.
The conditions of supply
These are the influences that shift the curve. A common mnemonic is PINTSWC, though what matters is understanding the mechanism in each case.
Productivity. Higher output per worker lowers the cost of each unit, so more is supplied at every price. Supply shifts right.
Indirect taxes. A tax on production raises costs, so less is supplied at every price. Supply shifts left. The curve shifts vertically upwards by the amount of the tax.
Number of firms. More firms in the market means more total output at every price. Supply shifts right. Firms leaving shifts it left.
Technology. An improvement lowers production costs and shifts supply right. Technology rarely moves backwards, though a breakdown or cyber-attack can temporarily shift supply left.
Subsidies. A payment to producers lowers their effective costs, shifting supply right — the mirror image of an indirect tax.
Weather and other shocks. Critical for agriculture and renewable energy. A poor harvest shifts supply left. This category also covers war, disease and natural disaster.
Costs of production. The broadest and most frequently used: wages, raw materials, energy, rent, borrowing costs. Any rise shifts supply left; any fall shifts it right.
Two further influences worth knowing:
- Prices of related goods in production. If a farmer can grow wheat or barley and the price of barley rises, the supply of wheat falls — the land is switched. These are competitive supply. Where two goods are produced together, such as beef and leather, they are in joint supply: a rise in the price of beef increases the supply of leather.
- Producer expectations. If producers expect a higher price soon, they may withhold stock now, reducing current supply.
The supply curve under perfect competition
Under perfect competition, each firm is a price taker and produces where price equals marginal cost. At any given price, the firm supplies the output at which its marginal cost equals that price. So the firm's supply curve is its marginal cost curve (the part above average variable cost), and the market supply curve adds these together across all firms.
Key terms
| Term | Meaning |
|---|---|
| Supply | The quantity producers are willing and able to offer at each price |
| Change in quantity supplied | A movement along the curve, caused by a change in the good's own price |
| Change in supply | A shift of the whole curve, caused by any other influence |
| Conditions of supply | The non-price influences that shift the supply curve |
| Competitive supply | Goods that compete for the same productive resources |
| Joint supply | Goods necessarily produced together |
| Subsidy | A payment to producers that lowers their costs |
| Marginal cost | The change in total cost from producing one more unit |
Common mistakes
- Shifting the curve when the price changes. A price change moves you along the curve.
- Using "supply" when you mean "quantity supplied". The two phrases mean different things, and using the wrong one describes the wrong diagram.
- Shifting the curve the wrong way for a tax. A tax raises costs, so supply falls and the curve shifts left — which looks like an upward shift, because the curve moves up by the tax per unit.
- Treating a demand-side change as shifting supply. A change in consumer income shifts demand, not supply.
- Forgetting that supply is a flow. It is a quantity per period, not a stock sitting in a warehouse.
How this has been examined
In the AQA papers indexed on this site, this topic has appeared in one format:
- 9-mark "Explain" data response — asked once (2019)
Where this goes next
Supply combines with demand in 4.1.3.5 The determination of equilibrium market prices, and the movement-versus-shift distinction mirrors 4.1.3.1 The determinants of the demand for goods and services. How responsive supply is to price follows in 4.1.3.4 Price elasticity of supply, and joint and competitive supply are developed in 4.1.3.6 The interrelationship between markets. The link between marginal cost and supply is built on in 4.1.5.3 Perfect competition, and the tax and subsidy shifts introduced here are used in 4.1.8.9 Government intervention in markets.
Otti is an AI tutor built for A-Level students. Ask it anything, practise exam questions, and get instant feedback written like an examiner would give it — not just right or wrong, but why.
Get one answer marked free