Edexcel A-Level Economics · Revision notes
1.2.2 Demand
Demand is the quantity of a good or service that consumers are willing and able to buy at each price, over a given period. This topic covers the most important distinction in introductory economics, between a movement along the demand curve and a shift of it, along with the factors that cause shifts and the reason the curve slopes downwards.
The demand curve
A demand curve plots price on the vertical axis against quantity demanded on the horizontal axis. It slopes downwards from left to right: as price falls, quantity demanded rises.
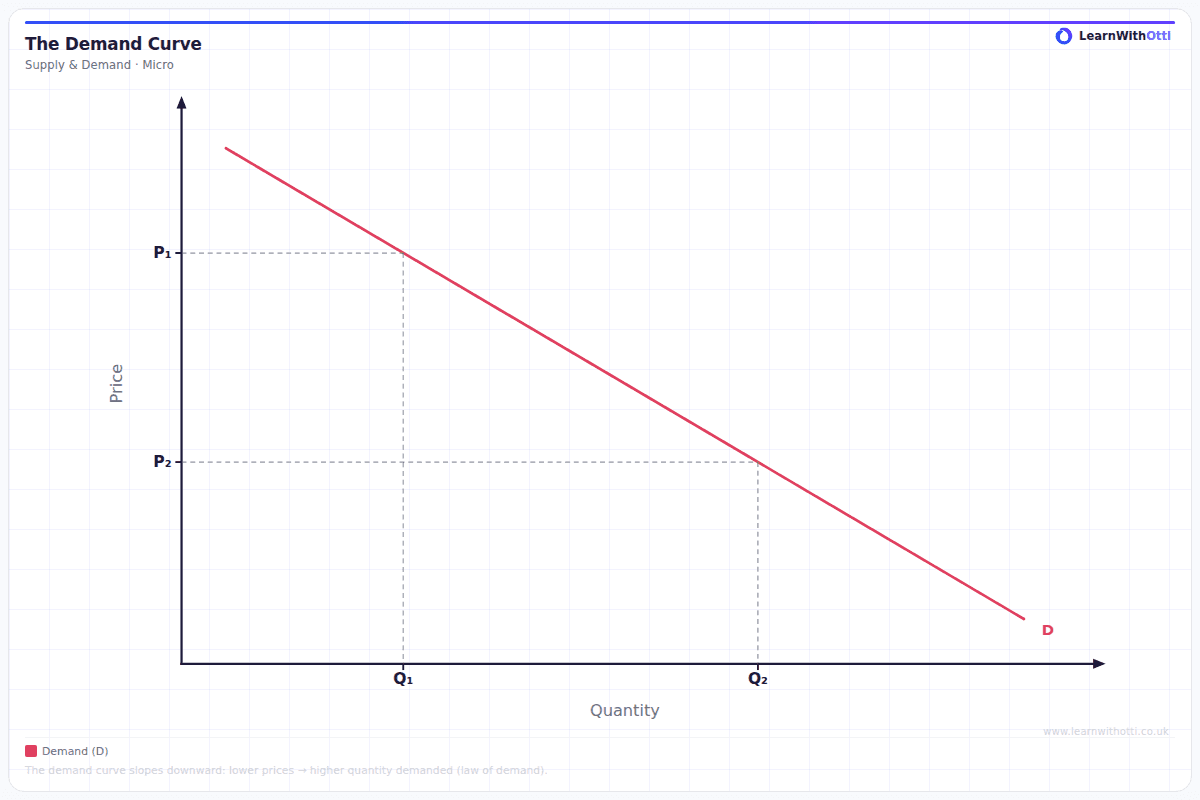
Two words in the definition matter:
- Willing means consumers want the good at that price.
- Able means they can afford it. Wanting a sports car is not demand unless the buyer has the money. Economists call this effective demand.
Movements along the demand curve
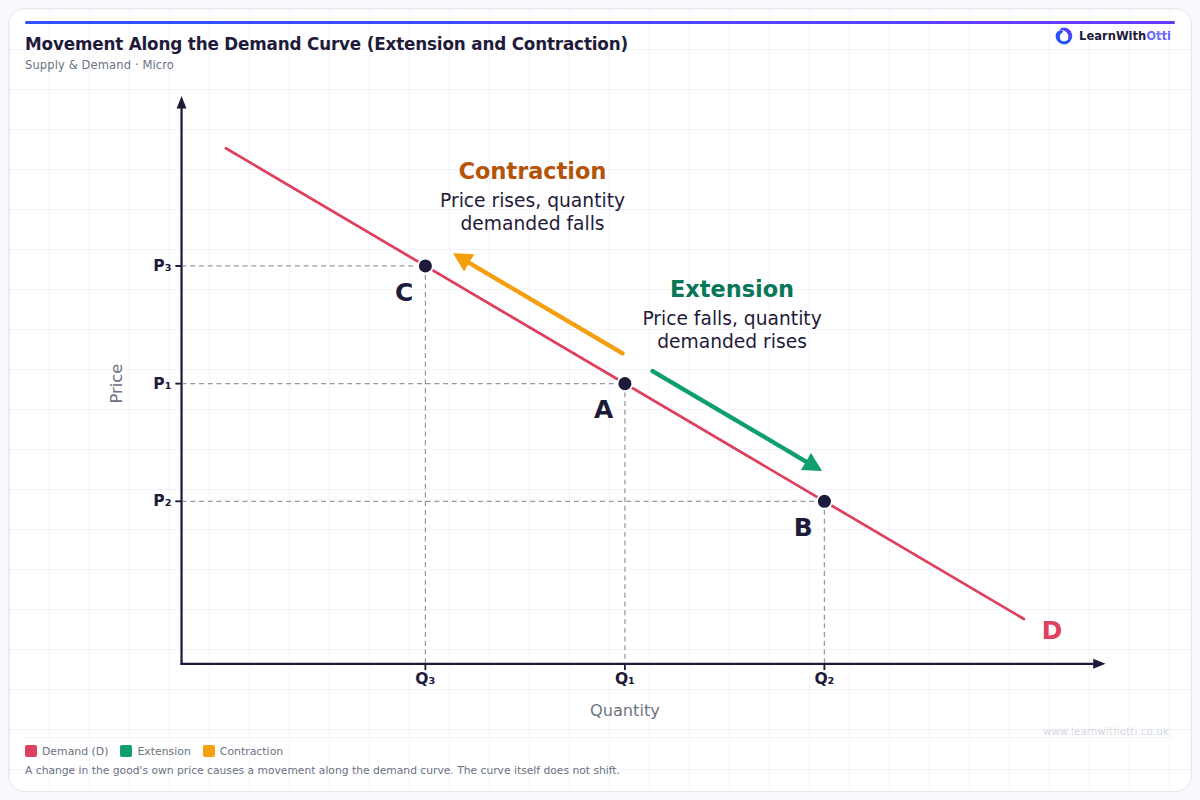
A change in the price of the good itself causes a movement along the existing demand curve.
- A fall in price causes an extension in demand: a movement down the curve to a higher quantity.
- A rise in price causes a contraction in demand: a movement up the curve to a lower quantity.
The curve itself does not move, because the relationship between price and quantity has not changed. The consumer is simply reading off a different point on the same curve.
Shifts of the demand curve
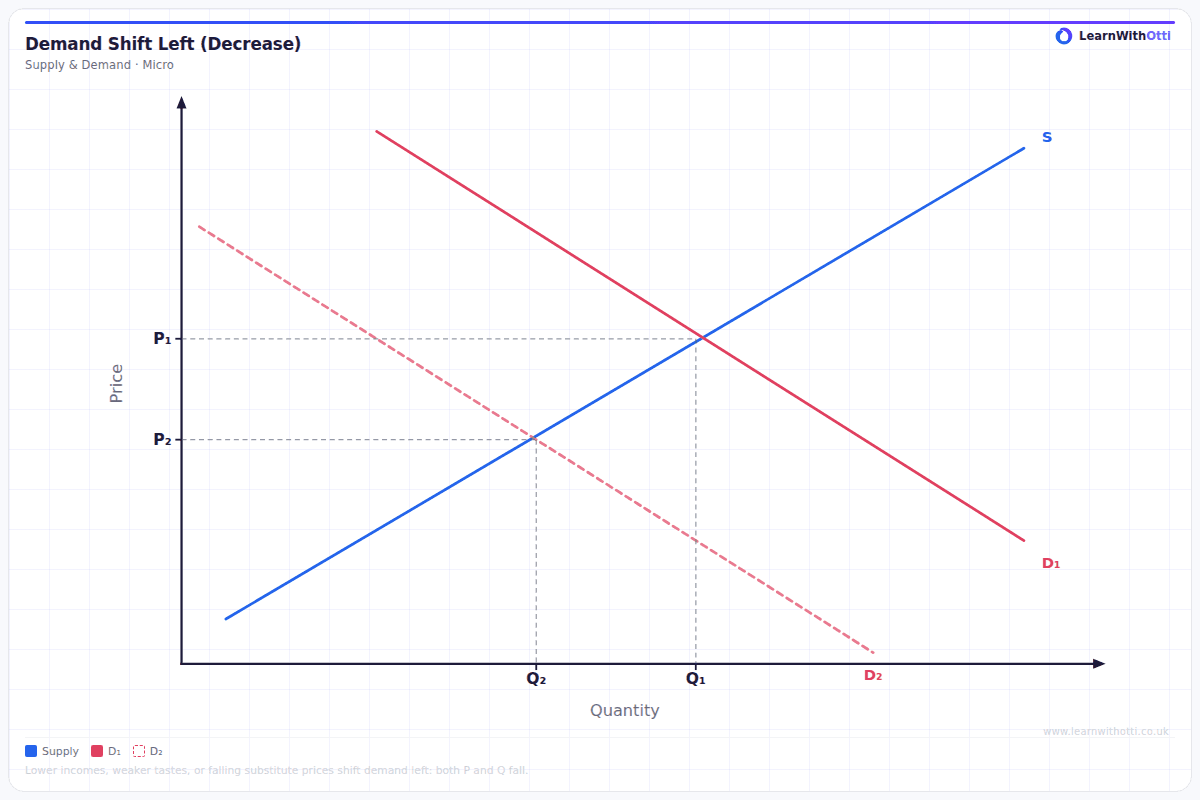
A change in any factor other than the good's own price shifts the whole demand curve. These factors are the conditions of demand.
- A shift to the right is an increase in demand: more is demanded at every price.
- A shift to the left is a decrease in demand: less is demanded at every price.
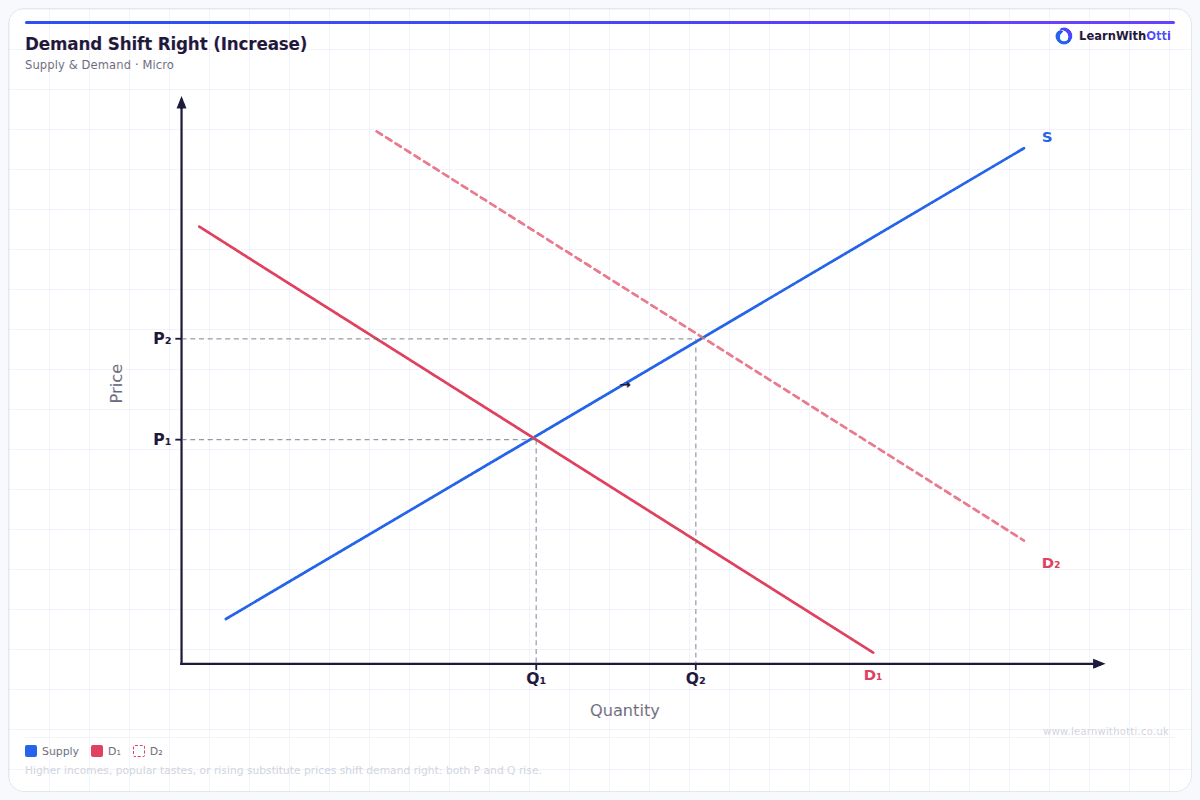
The main conditions of demand are:
- Income. For a normal good, a rise in income increases demand. For an inferior good, such as supermarket own-brand basics, a rise in income reduces demand as consumers switch to better alternatives.
- The price of substitutes. If the price of a rival brand rises, demand for this good increases as consumers switch.
- The price of complements. If the price of games consoles falls, demand for the games that go with them increases.
- Tastes and preferences. Fashion, health concerns or social trends can raise or lower demand. Demand for plant-based food has risen as attitudes to meat have changed.
- Advertising. Successful advertising increases demand and can make it less sensitive to price.
- Population. A larger population, or a change in its age structure, changes demand. An ageing population increases demand for health care.
- Expectations. If consumers expect prices to rise soon, they may buy now, increasing current demand.
- Credit availability and interest rates. Easier and cheaper borrowing increases demand for goods often bought on credit, such as cars and furniture.
Key distinction: A useful check: if the explanation starts with "the price of this good changed", it is a movement. If it starts with anything else, it is a shift.
Diminishing marginal utility and the shape of the demand curve
Marginal utility is the extra satisfaction a consumer gets from consuming one more unit of a good. The law of diminishing marginal utility states that, as a consumer consumes more of a good, the marginal utility from each additional unit falls.
The first slice of pizza when hungry brings a lot of satisfaction. The fourth brings much less.
This explains the downward slope of the demand curve:
- A rational consumer buys one more unit only if the satisfaction it brings is worth at least its price.
- Because each additional unit brings less satisfaction than the last, the consumer will only buy more if the price falls.
- So a lower price is needed to persuade consumers to buy a larger quantity.
Two other effects reinforce the downward slope. When price falls, consumers' real income rises, so they can afford more (the income effect). The good also becomes cheaper relative to substitutes, so consumers switch towards it (the substitution effect).
Key terms
| Term | Meaning |
|---|---|
| Demand | The quantity consumers are willing and able to buy at each price over a given period |
| Effective demand | Demand backed by the ability to pay |
| Extension / contraction | A movement along the demand curve caused by a change in the good's own price |
| Increase / decrease in demand | A shift of the whole demand curve caused by a change in a condition of demand |
| Conditions of demand | The factors other than own price that determine demand |
| Normal good | A good for which demand rises as income rises |
| Inferior good | A good for which demand falls as income rises |
| Marginal utility | The extra satisfaction from consuming one more unit |
Common mistakes
- Saying a price change shifts the demand curve. A change in the good's own price causes a movement along the curve. Only the conditions of demand shift it.
- Mixing up "demand" and "quantity demanded". A price change alters quantity demanded; a change in a condition of demand alters demand.
- Shifting the curve the wrong way for an inferior good. A rise in income shifts demand for an inferior good to the left.
- Describing the curve without explaining it. The downward slope needs a reason: diminishing marginal utility, supported by the income and substitution effects.
- Labelling the axes the wrong way round. Price goes on the vertical axis and quantity on the horizontal.
How this has been examined
In the Edexcel papers indexed on this site, this topic has appeared in three formats:
- 8-mark "Examine" data response — asked once (2020)
- 2-mark "Explain" data response — asked once (2018)
- 1-mark multiple choice — asked once (2018)
Where this goes next
The assumption that consumers maximise utility comes from 1.2.1 Rational decision making. How strongly demand responds to price, income and the prices of other goods is measured in 1.2.3 Price, income and cross elasticities of demand. Demand meets supply in 1.2.6 Price determination, and the reasons consumers may not behave as this model assumes are covered in 1.2.10 Alternative views of consumer behaviour.
Otti is an AI tutor built for A-Level students. Ask it anything, practise exam questions, and get instant feedback written like an examiner would give it — not just right or wrong, but why.
Get one answer marked free