Edexcel A-Level Economics · Revision notes
1.2.6 Price Determination
What the specification covers
In our own words — not the official specification wording
How price and quantity settle where demand and supply meet, what happens when they do not, and how the market corrects itself.
- The price and quantity at which the amount buyers want matches the amount sellers offer, and how the market arrives there.
- Showing on a diagram the situations where sellers offer more than buyers want, and where buyers want more than sellers offer.
- How price adjusts to remove a surplus or a shortage.
- Using diagrams to show how a shift in demand or supply changes the price and quantity, applied to real situations.
Bring demand and supply together and the market settles at one price and one quantity. This topic is the engine room of Theme 1: almost every market question in the course is an application of the diagram you learn here.
Equilibrium
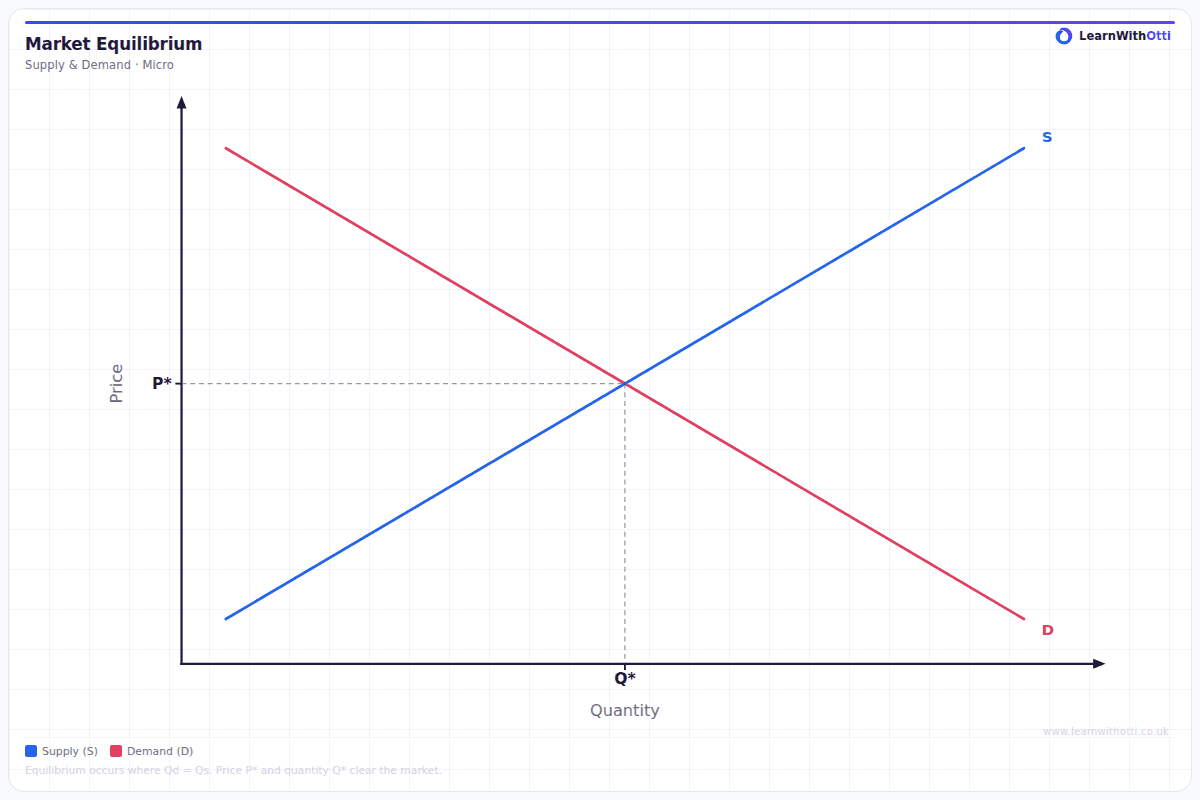
Equilibrium is the price at which the quantity demanded exactly equals the quantity supplied. On a diagram it is where the two curves cross.
At that price there is no tendency to change. Every buyer willing to pay it finds a seller, and every seller willing to accept it finds a buyer. This is also called the market-clearing price, because nothing is left over and nobody is left wanting.
Disequilibrium: excess supply and excess demand
Excess supply (a surplus) occurs when price is above equilibrium. Producers offer more than consumers want. Unsold stock accumulates, so sellers cut prices to shift it. As price falls, quantity supplied contracts and quantity demanded extends until the surplus disappears.
Excess demand (a shortage) occurs when price is below equilibrium. Consumers want more than producers offer. Buyers compete, bidding the price up. As price rises, quantity demanded contracts and quantity supplied extends until the shortage disappears.
Watch out: Notice the verbs: as price changes, quantities extend and contract along the curves. Nothing shifts. These are movements, because the cause is price.
This self-correction is the price mechanism at work. No one organises it; it emerges from buyers and sellers acting in their own interest.
How shifts change the equilibrium
This is the part that matters most, because it is how every real-world question gets answered.
| What shifts | Effect on price | Effect on quantity |
|---|---|---|
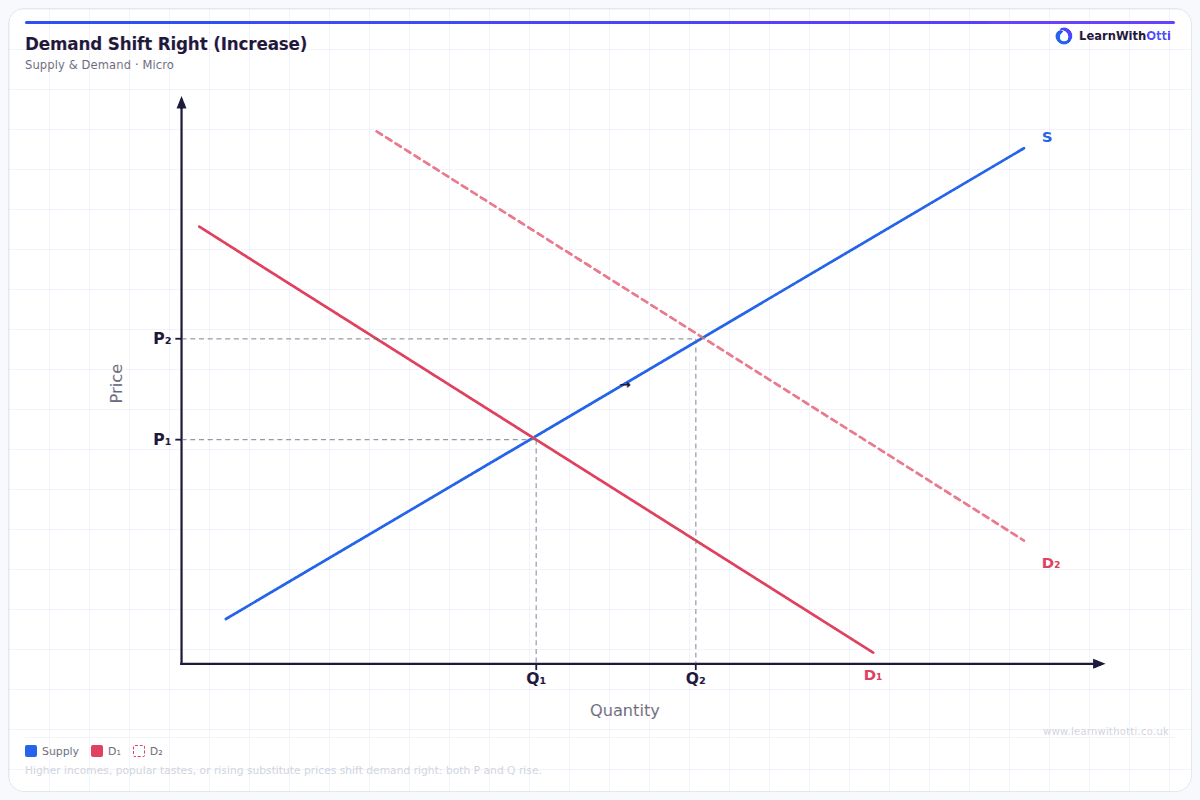
| Demand increases (shifts right) | Rises | Rises |
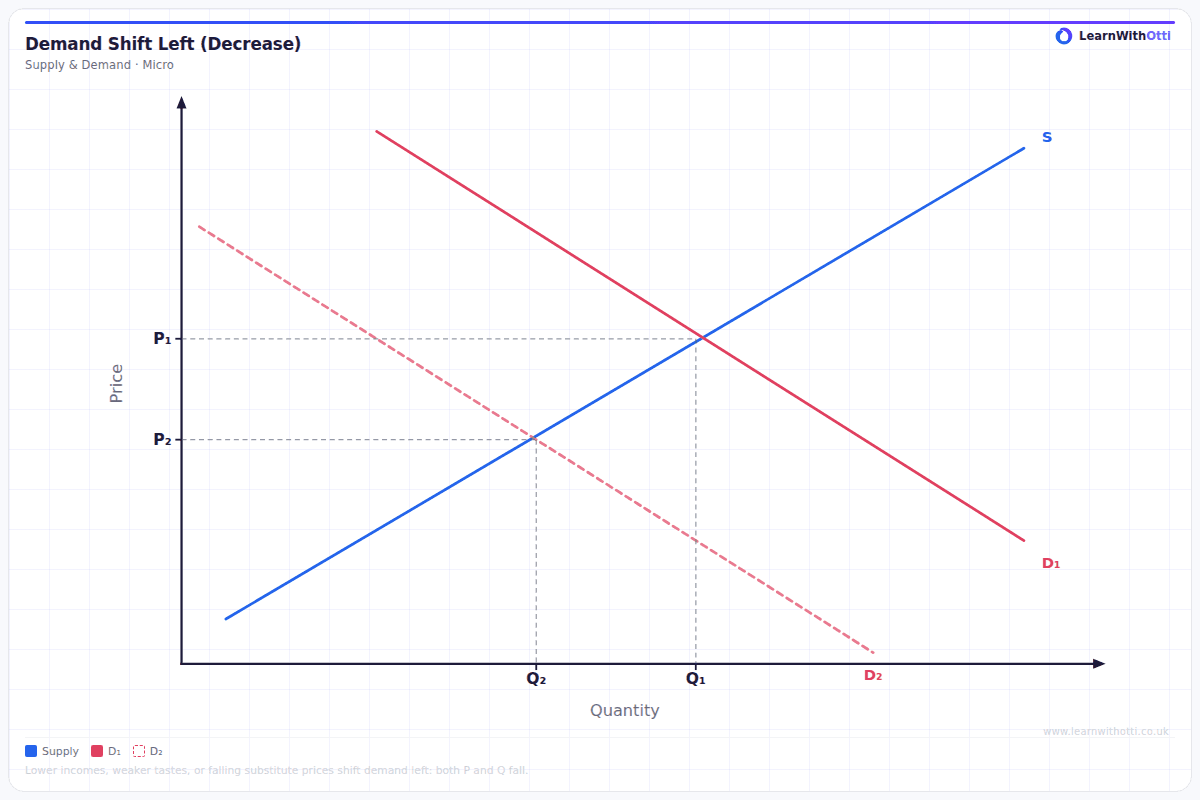
| Demand decreases (shifts left) | Falls | Falls |
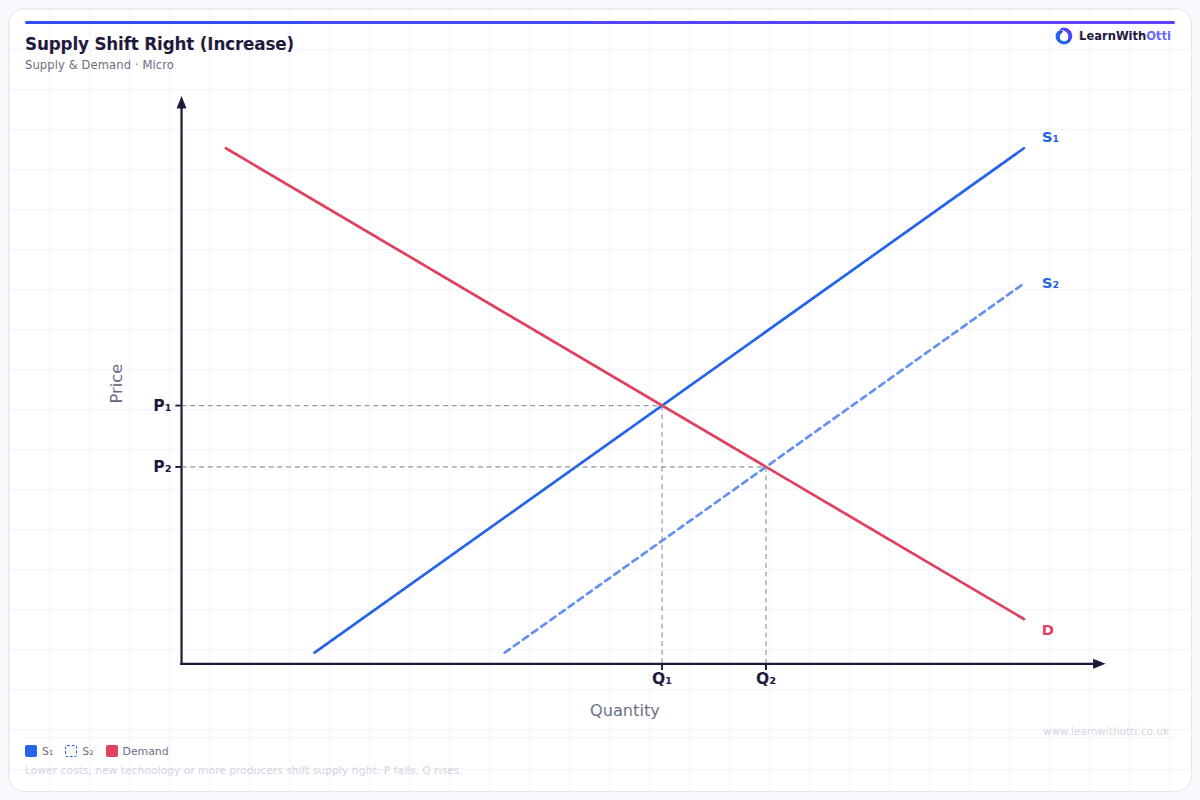
| Supply increases (shifts right) | Falls | Rises |
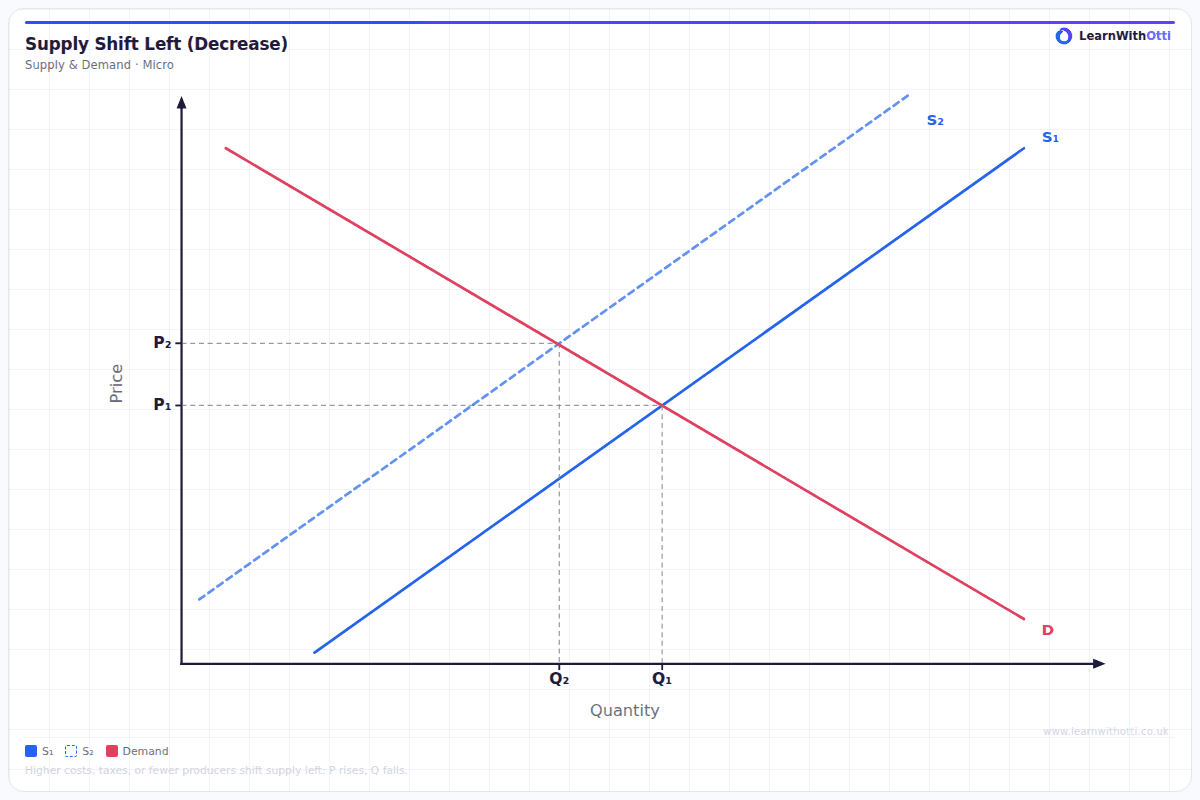
| Supply decreases (shifts left) | Rises | Falls |
Key idea: The pattern is worth internalising: a demand shift moves price and quantity in the same direction; a supply shift moves them in opposite directions.
A method that works every time
- Identify which curve shifts. If the cause relates to buyers, it is demand. If it relates to producers or costs, it is supply.
- Decide the direction, and say why.
- Mark the new equilibrium and read off the new price and quantity.
- Label everything: both axes, both curves before and after, and both equilibria.
Worked example
A poor harvest reduces the wheat crop.
Supply shifts left (a condition of supply has worsened). At the old price there is now excess demand, so price is bid up. The new equilibrium has a higher price and lower quantity. Demand has not moved — the quantity demanded has contracted along an unchanged demand curve.
When both curves shift
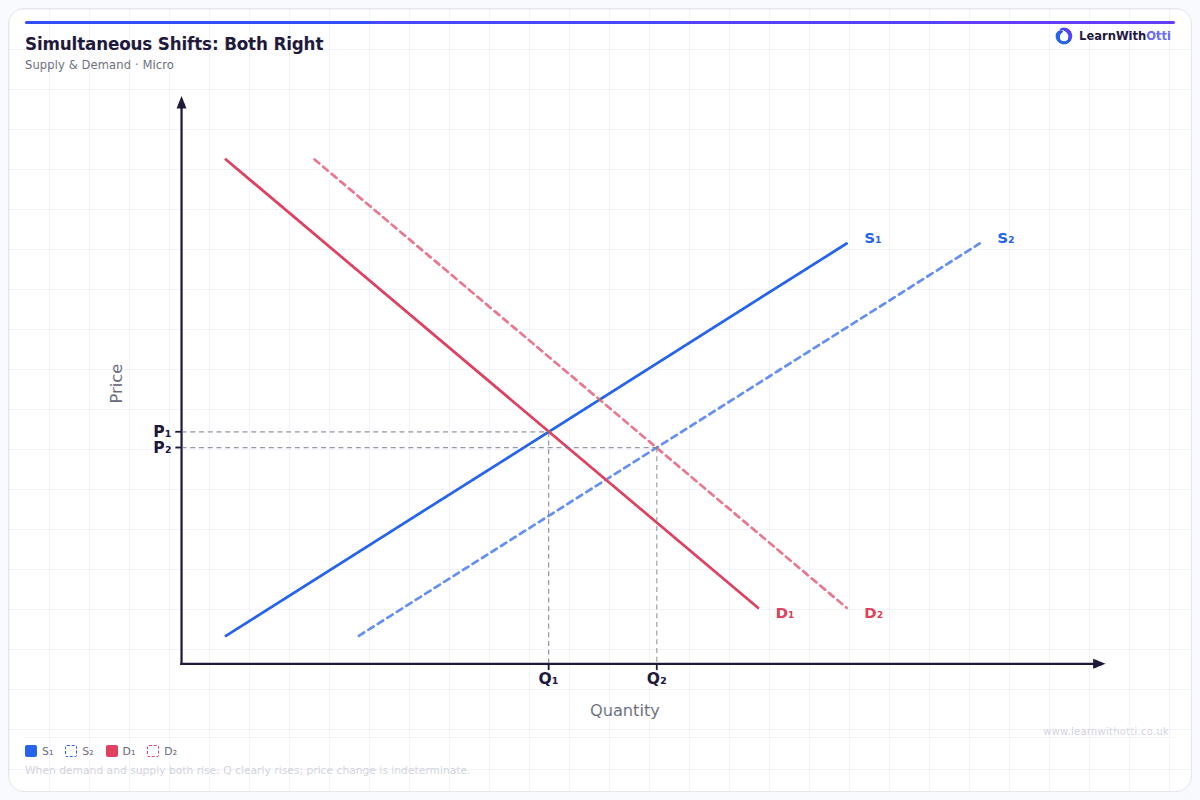
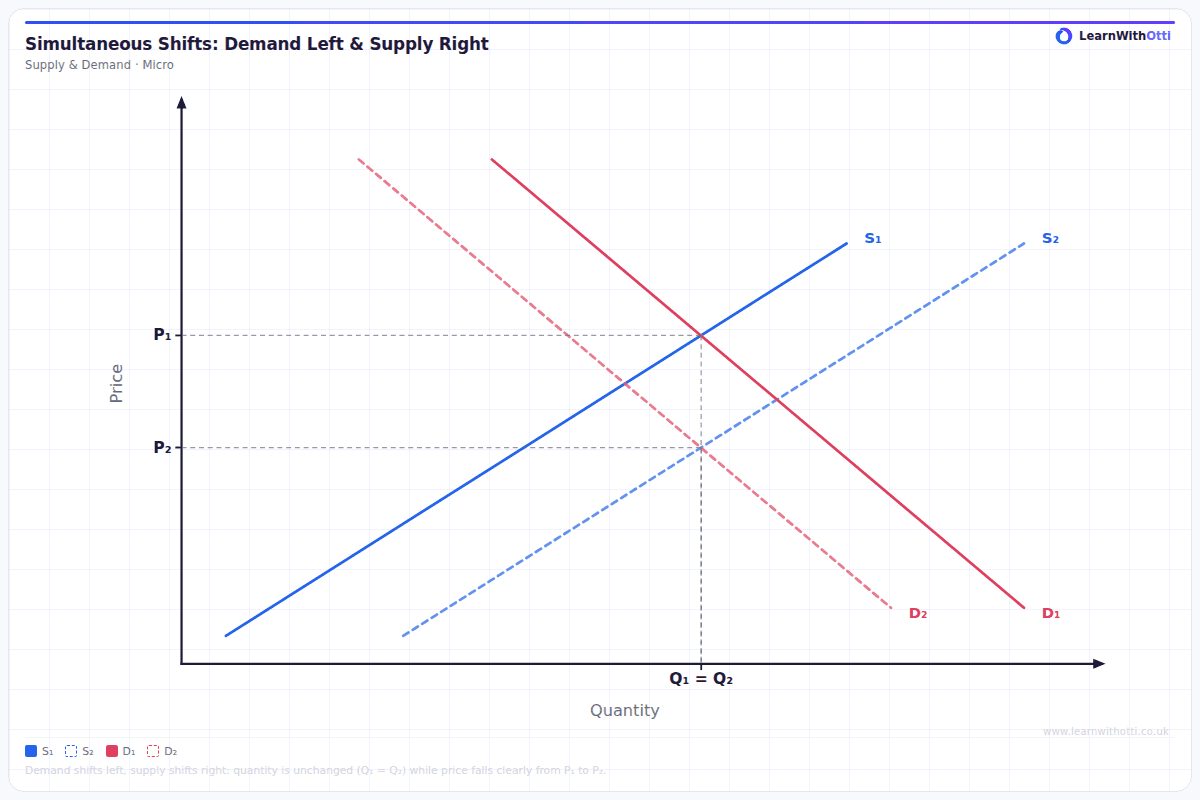
If demand and supply both shift, one outcome is determinate and the other is ambiguous.
- Demand rises and supply rises: quantity definitely rises; the price change depends on which shift is larger.
- Demand rises and supply falls: price definitely rises; the quantity change is ambiguous.
Saying which variable cannot be predicted, and that it depends on the relative size of the shifts, is the correct answer rather than a hedge.
Elasticity and the size of the effect
How far price moves rather than quantity depends on elasticity.
- If supply is inelastic, a demand shift causes a large price change and a small quantity change. This is why housing and oil prices are volatile.
- If supply is elastic, the same demand shift causes mostly a quantity change with little price movement.
The same logic applies to demand elasticity when supply shifts.
Key terms
| Term | Meaning |
|---|---|
| Equilibrium | The price at which quantity demanded equals quantity supplied |
| Market-clearing price | Another term for the equilibrium price |
| Excess supply | A surplus, arising when price is above equilibrium |
| Excess demand | A shortage, arising when price is below equilibrium |
| Disequilibrium | Any situation where the market is not clearing |
| Extension and contraction | Movements along a curve in response to a price change |
Common mistakes
- Shifting a curve when the price changes. If price is the cause, you move along.
- Shifting the wrong curve. Ask who changed their behaviour: buyers means demand, producers or costs means supply.
- Unlabelled diagrams. Both axes, both curves before and after, and both equilibria need labelling for the diagram to say anything.
- Giving a definite answer when both curves shift. One variable cannot be predicted; say which and why.
- Describing the new equilibrium without the adjustment. The surplus or shortage, and the price movement that removes it, is the mechanism, not a detail.
How this has been examined
In the Edexcel papers indexed on this site, this topic has appeared in eight formats:
- 4-mark "Draw" — asked 3 times across 3 series (2019 to 2022)
- 25-mark "Evaluate" essay — asked twice across 2 series (2018 to 2020)
- 5-mark "Explain" data response — asked twice across 2 series (2018 to 2024)
- 8-mark "Examine" data response — asked once (2022)
- 4-mark calculation — asked once (2017)
- 2-mark calculation — asked once (2023)
- 2-mark "Explain" — asked once (2018)
- 1-mark multiple choice — asked once (2021)
Where this goes next
The curves combined here come from 1.2.2 Demand and 1.2.4 Supply, and how far price moves rather than quantity depends on 1.2.3 Price, income and cross elasticities of demand and 1.2.5 Elasticity of supply. What the resulting price actually does for the economy is 1.2.7 Price mechanism, and the welfare it generates is measured in 1.2.8 Consumer and producer surplus. Every intervention in 1.4.1 Government intervention in markets is an application of this diagram.
Otti is an AI tutor built for A-Level students. Ask it anything, practise exam questions, and get instant feedback written like an examiner would give it — not just right or wrong, but why.
Get one answer marked free