Edexcel A-Level Economics · Revision notes
2.3.1 The characteristics of AS
Aggregate supply (AS) is the total output that all the firms in an economy are willing and able to produce at each price level, over a given period. It is the supply side of the macroeconomic model, the counterpart to aggregate demand. This topic introduces the AS curve, the difference between a movement along it and a shift, and how short-run and long-run aggregate supply relate to each other.
The AS curve
The AS curve is drawn on the same axes as aggregate demand: the price level on the vertical axis and real national output (real GDP) on the horizontal axis.
Economists distinguish two versions:
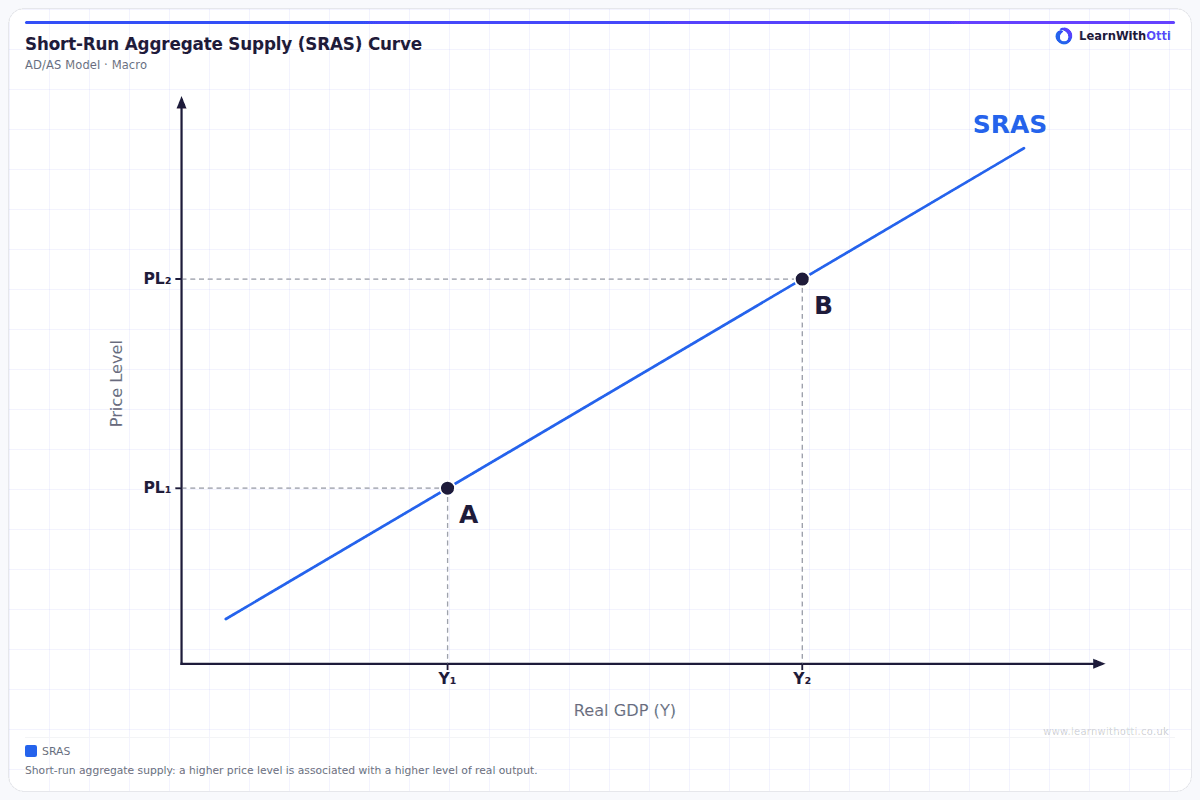
- Short-run aggregate supply (SRAS) shows how much firms produce at each price level using the current factors of production.
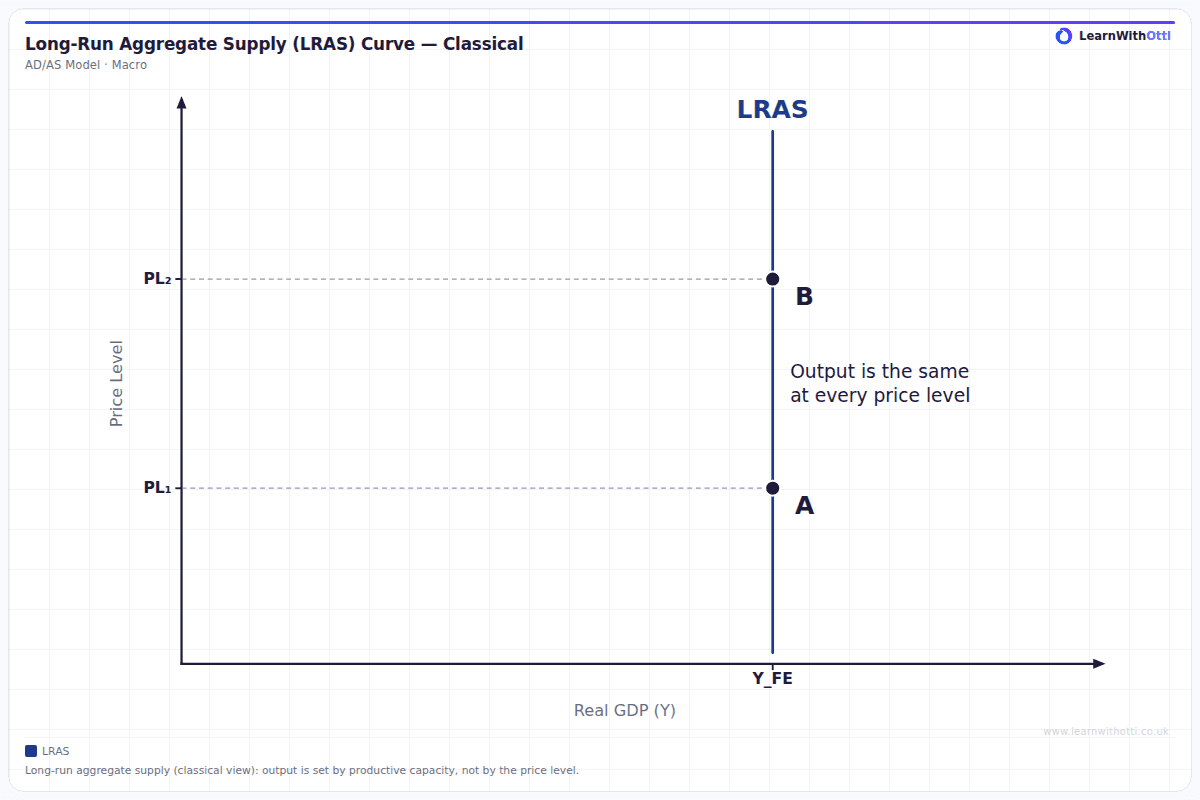
- Long-run aggregate supply (LRAS) shows the economy's productive capacity: the maximum output it can sustain when all factors of production are fully employed.
Why the SRAS curve slopes upwards
In the short run, many of a firm's costs are fixed or slow to change. Wages, for example, are set in contracts and agreed only once a year. If the general price level rises while costs stay the same, each unit of output becomes more profitable, so firms produce more.
As output rises, firms also have to pay overtime, use older or less efficient machinery and bid for scarcer resources, so their costs rise. They will only supply more if prices rise to cover those costs. Both effects give an upward-sloping SRAS curve.
Movements along and shifts of the AS curve
The distinction mirrors the one for microeconomic supply.
Key distinction: A movement along the SRAS curve is caused by a change in the price level. This usually happens because aggregate demand has changed.
If AD increases, the price level rises and firms respond by producing more: the economy moves up along the existing SRAS curve.
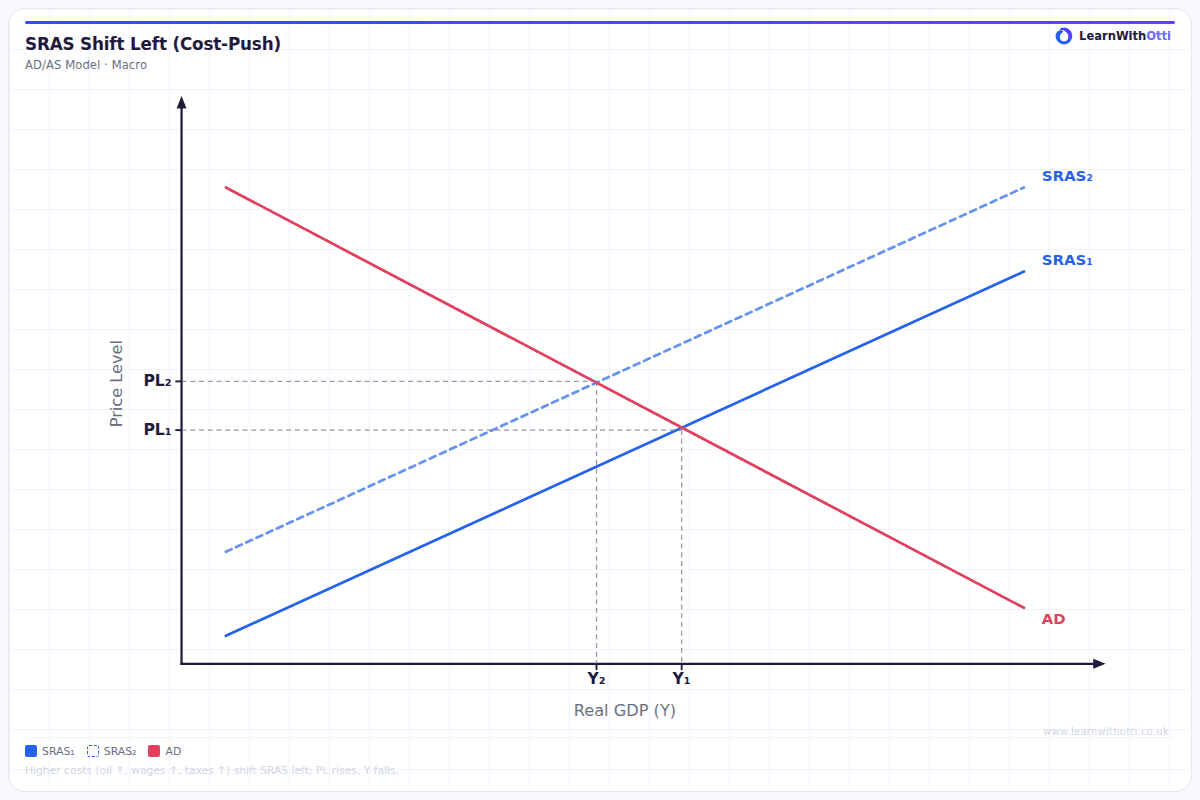
A shift of the SRAS curve is caused by a change in firms' costs of production at every price level. For example:
- a rise in wages, raw material prices or energy prices shifts SRAS to the left: at every price level, firms produce less;
- a fall in those costs, or a rise in productivity, shifts SRAS to the right.
A shift of the LRAS curve is caused by a change in the economy's productive capacity: the quantity or quality of its factors of production. More workers, better skills, more capital and new technology shift LRAS to the right. These factors are covered in 2.3.3 Long-run AS.
The relationship between SRAS and LRAS
Key distinction: SRAS shows what firms will produce in the short run, before costs have adjusted. LRAS shows what the economy can produce in the long run, once all prices and wages have adjusted.
Economists disagree about what the LRAS curve looks like, and the two views lead to very different conclusions about policy.
The classical (free market) view
Classical economists draw LRAS as a vertical line at the economy's full-capacity level of output.
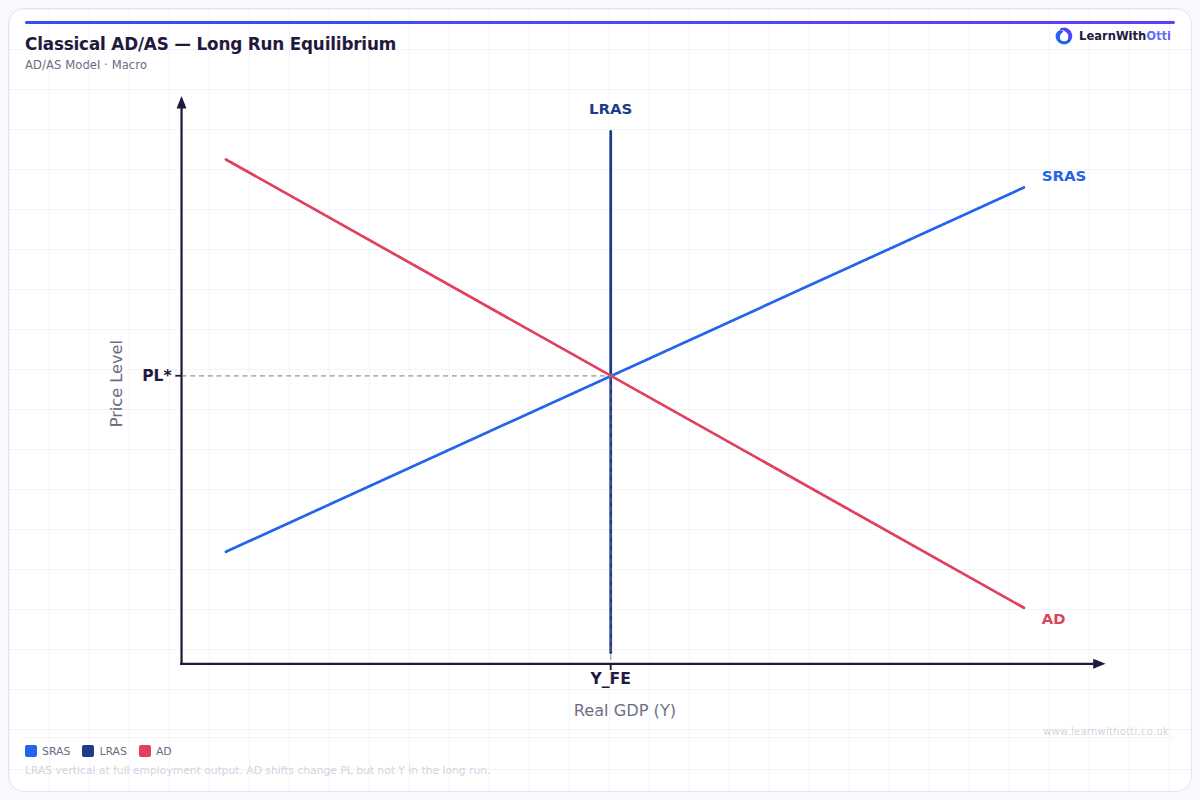
In the short run, output can rise above or fall below this level. But in the long run, wages and prices adjust. If output is above capacity, labour becomes scarce and wages rise, shifting SRAS to the left until output returns to the LRAS. If output is below capacity, wages fall and SRAS shifts right.
Key idea: So in the long run, output is determined by productive capacity alone, and a rise in AD only raises the price level.
The Keynesian view
Keynesian economists draw LRAS with three sections:
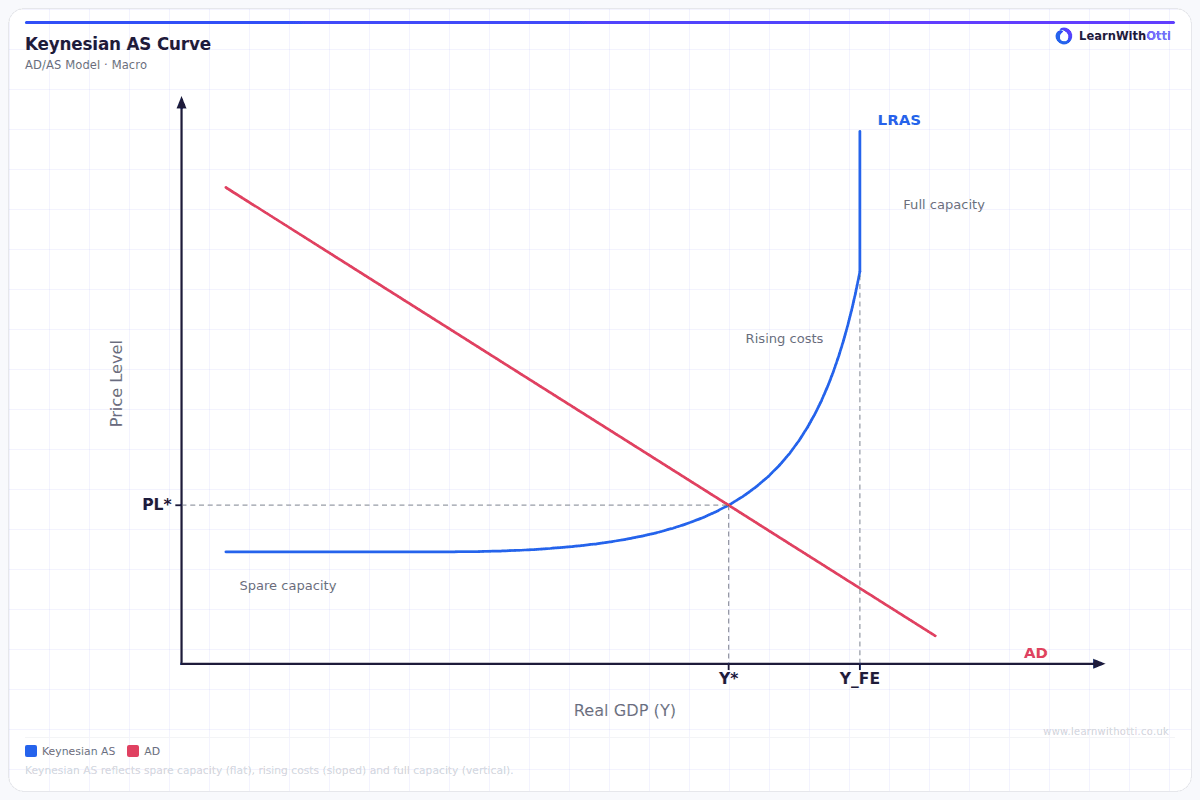
- a horizontal section at low output, where there is a lot of spare capacity, so output can rise without any rise in the price level;
- an upward-sloping section, where bottlenecks appear as some resources become scarce, so rising output puts upward pressure on prices;
- a vertical section at full capacity, where output cannot rise any further.
Keynesians argue that the economy can stay below full capacity for long periods, because wages do not fall easily. On this view, a rise in AD in a recession can raise output and employment without causing inflation.
Key terms
| Term | Meaning |
|---|---|
| Aggregate supply | The total output firms are willing and able to produce at each price level |
| Short-run aggregate supply | How much firms produce at each price level using the current factors of production |
| Long-run aggregate supply | The economy's productive capacity when all factors are fully employed |
| Productive capacity | The maximum output an economy can sustain with its existing resources |
| Spare capacity | Unused resources that could be brought into production |
Common mistakes
- Shifting SRAS when the price level changes. A change in the price level causes a movement along SRAS. Only a change in costs shifts it.
- Confusing SRAS and LRAS shifts. Cost changes shift SRAS; changes in productive capacity shift LRAS.
- Drawing only one version of LRAS. The classical and Keynesian shapes lead to different conclusions, and the difference matters for policy.
- Labelling the axes as price and quantity. In macroeconomics the axes are the price level and real national output.
How this has been examined
This topic has not appeared as a standalone question in the Edexcel papers indexed on this site.
It sets up the AS curve used throughout Theme 2, and its ideas are developed in the topics on short-run AS, long-run AS and macroeconomic equilibrium.
Where this goes next
The demand side of the model is in 2.2.1 The characteristics of AD. The factors that shift SRAS are covered in 2.3.2 Short-run AS, and those that shift LRAS in 2.3.3 Long-run AS. AD and AS are brought together to find equilibrium output in 2.4.3 Equilibrium levels of real national output, and the gap between actual and potential output is explained in 2.5.2 Output gaps.
Otti is an AI tutor built for A-Level students. Ask it anything, practise exam questions, and get instant feedback written like an examiner would give it — not just right or wrong, but why.
Get one answer marked free