Edexcel A-Level Economics · Revision notes
2.4.3 Equilibrium levels of real national output
Aggregate demand and aggregate supply together determine the economy's price level and its real output. This topic brings the two halves of the macroeconomic model together, defines equilibrium, and shows how shifts in either curve change the outcome.
Equilibrium real national output
Equilibrium real national output is the level of output at which aggregate demand equals aggregate supply. At this point, the total amount that households, firms, the government and foreign buyers want to spend on domestic output is exactly matched by the amount firms want to produce.
- In the short run, equilibrium is where the AD curve crosses the SRAS curve.
- In the long run, in the classical view, the economy settles where AD crosses SRAS on the LRAS curve, at full capacity.
Why the economy moves towards equilibrium
- If AD is greater than AS at the current price level, there is excess demand. Firms run down their stocks, raise prices and increase output, moving the economy towards equilibrium.
- If AD is less than AS, firms cannot sell everything they produce. Unsold stocks build up, and firms cut prices and output.
Watch out: Equilibrium is not necessarily a good outcome. An economy can be in equilibrium with high unemployment, below its productive capacity.
A shift in aggregate demand
A shift in AD is caused by a change in consumption, investment, government spending or net trade.
An increase in AD (a shift to the right):
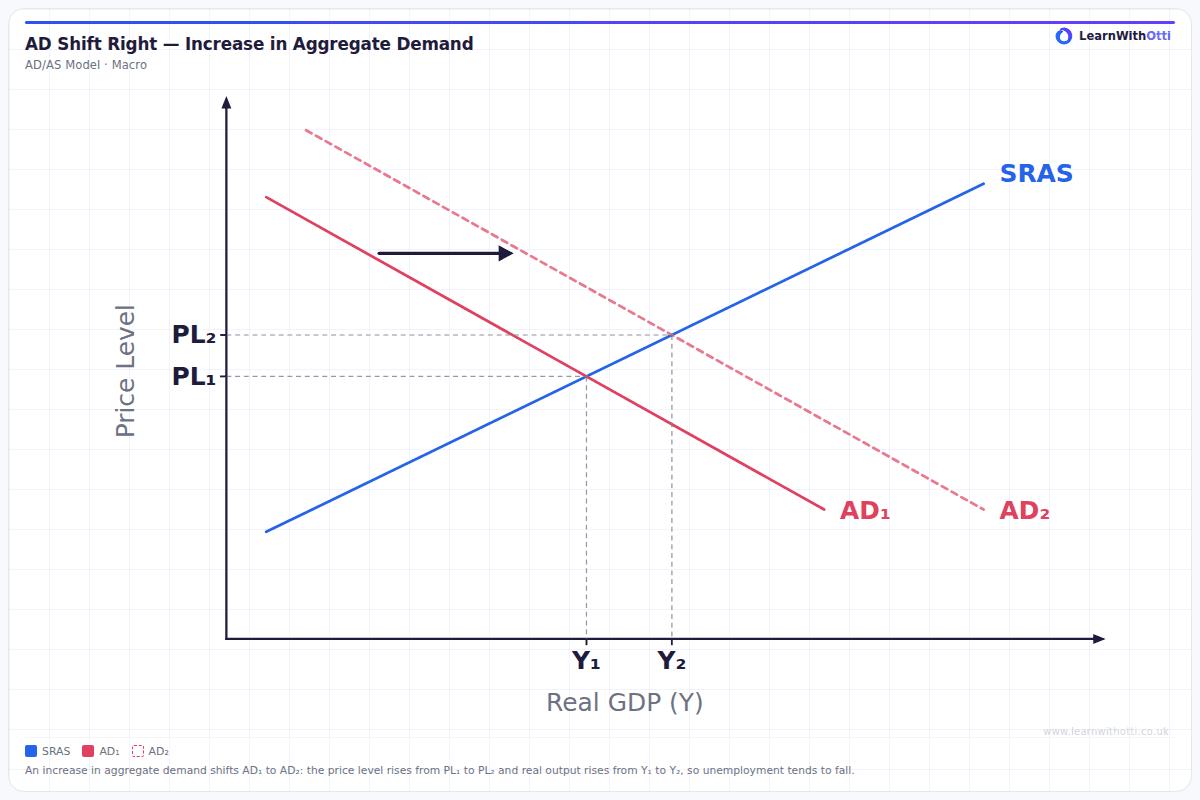
- the price level rises;
- real output rises, and unemployment tends to fall.
Evaluation: How much of the effect falls on output and how much on prices depends on how close the economy is to full capacity. With a lot of spare capacity, most of the effect is on output. Close to full capacity, most of it is on prices, which is demand-pull inflation.
A decrease in AD (a shift to the left):
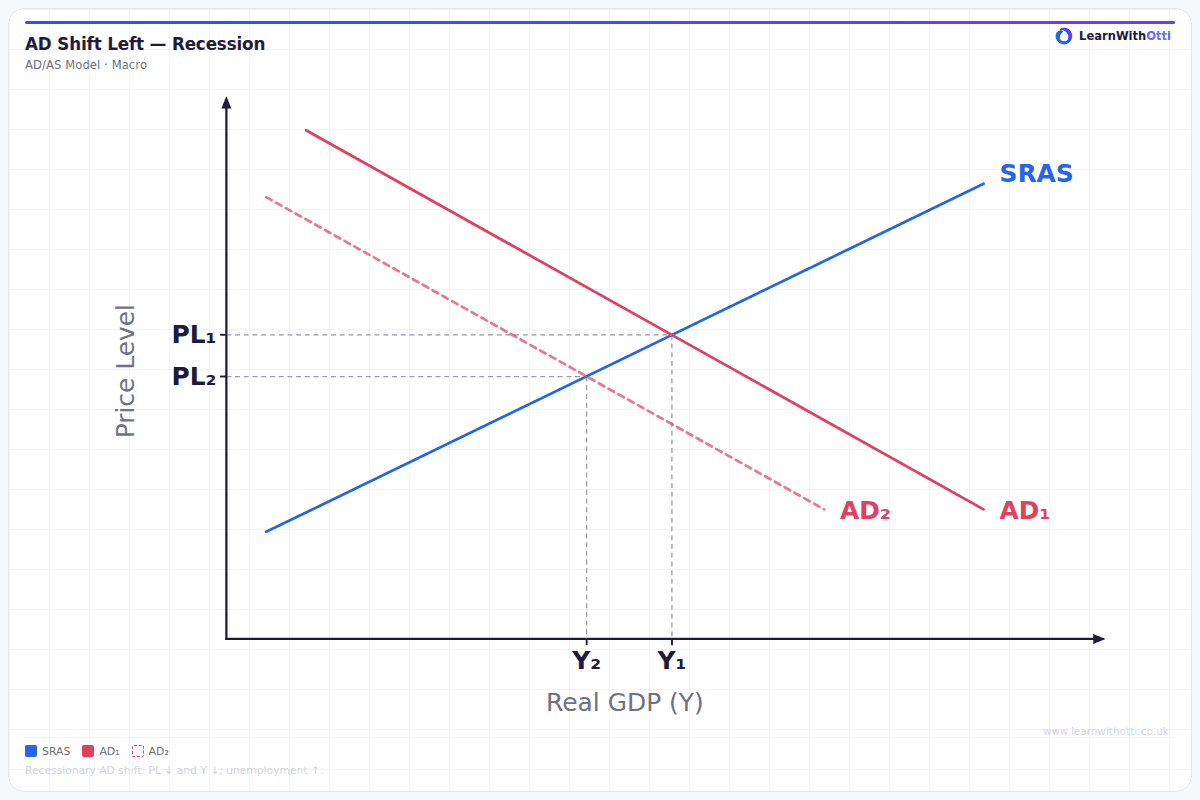
- the price level falls, or rises more slowly;
- real output falls, and unemployment rises. A large fall in AD can push the economy into recession.
A shift in short-run aggregate supply
A shift in SRAS is caused by a change in firms' costs.
A decrease in SRAS (a shift to the left), for example from a rise in energy prices:
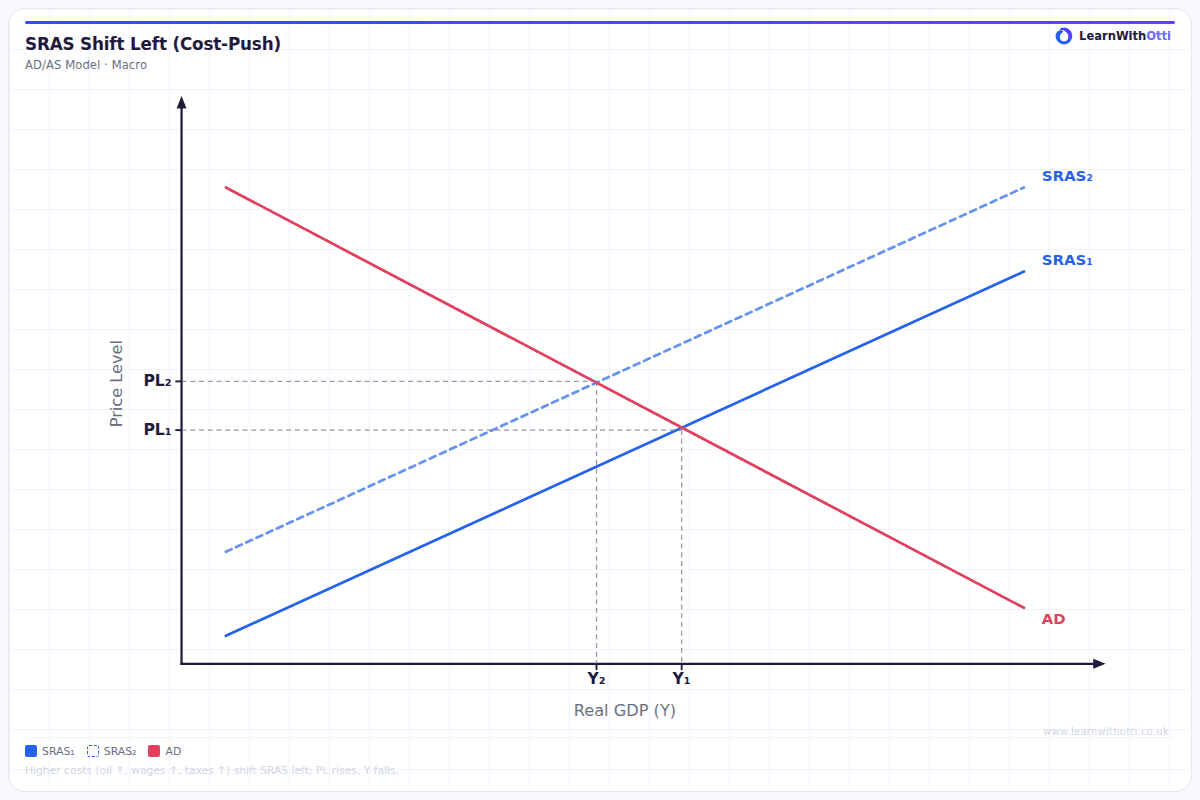
- the price level rises, which is cost-push inflation;
- real output falls, and unemployment rises.
Evaluation: This combination of rising prices and falling output is especially difficult for policymakers, because measures to reduce inflation make the fall in output worse.
An increase in SRAS (a shift to the right) lowers the price level and raises real output.
A shift in long-run aggregate supply
A shift in LRAS is caused by a change in the quantity or quality of the factors of production.
An increase in LRAS (a shift to the right):
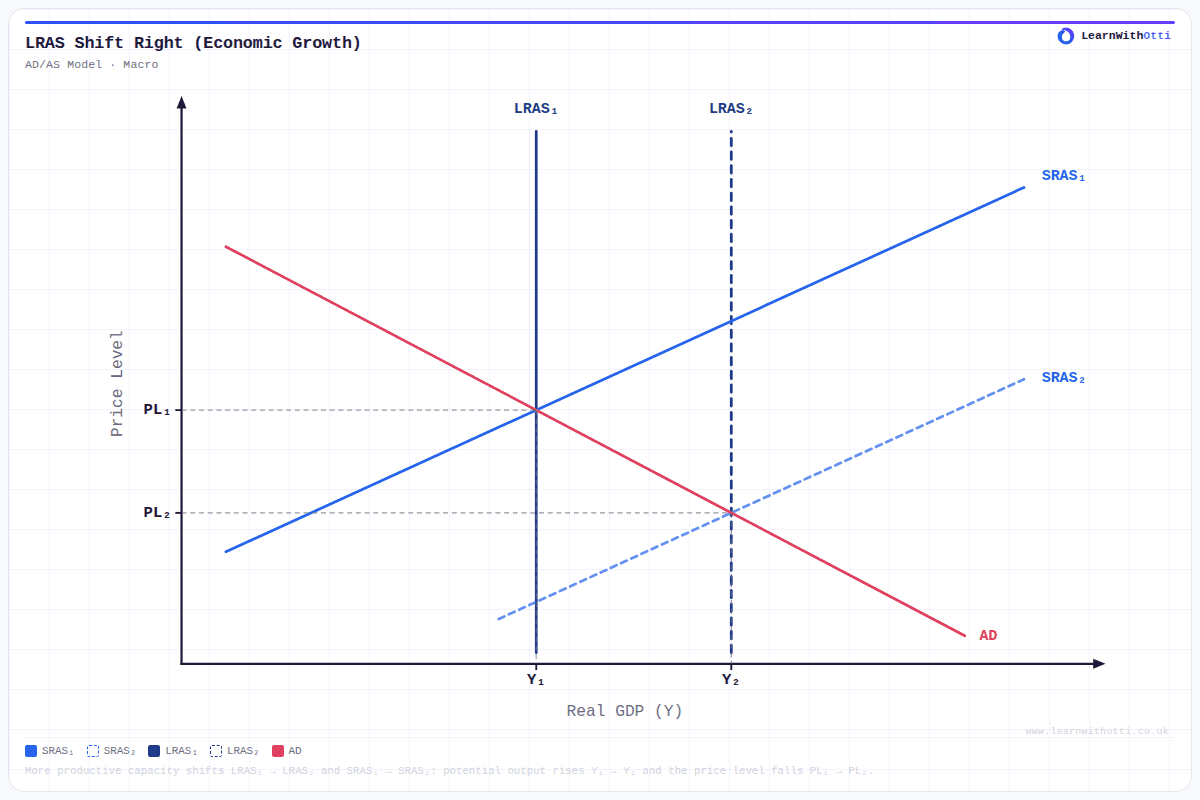
- the economy's productive capacity rises;
- real output can rise without the price level rising, so growth is achieved without inflation.
This is the most desirable kind of change, because it raises potential output and living standards. But it usually takes years to achieve.
Using AD/AS diagrams
When analysing any change in the economy:
- Identify which curve is affected: AD, SRAS or LRAS.
- Decide which way it shifts, and explain why.
- Show the new equilibrium, with the new price level and real output.
- Explain the effect on the price level, real output and, where relevant, unemployment.
- Consider whether the economy is close to full capacity, which affects how much of a change in AD shows up in output rather than prices.
Key terms
| Term | Meaning |
|---|---|
| Equilibrium real national output | The output at which aggregate demand equals aggregate supply |
| Demand-pull inflation | Inflation caused by aggregate demand growing faster than aggregate supply |
| Cost-push inflation | Inflation caused by rising costs of production |
| Recession | A fall in real output, usually defined as two consecutive quarters of negative growth |
| Spare capacity | Unused resources that could be brought into production |
Common mistakes
- Shifting the wrong curve. A change in spending shifts AD; a change in costs shifts SRAS; a change in productive capacity shifts LRAS.
- Ignoring the starting position. The effect of a rise in AD depends on how much spare capacity there is.
- Stating the effect on only one variable. Every shift changes both the price level and real output.
- Treating equilibrium as the ideal outcome. The economy can be in equilibrium with high unemployment.
How this has been examined
This topic has not appeared as a standalone question in the Edexcel papers indexed on this site.
Where this goes next
The two curves are built up in 2.2.1 The characteristics of AD and 2.3.1 The characteristics of AS. The size of the effect of a change in AD is examined in 2.4.4 The multiplier, and the gap between actual and potential output in 2.5.2 Output gaps. Policies that shift AD and AS are covered in 2.6.2 Demand-side policies and 2.6.3 Supply-side policies.
Otti is an AI tutor built for A-Level students. Ask it anything, practise exam questions, and get instant feedback written like an examiner would give it — not just right or wrong, but why.
Get one answer marked free