Edexcel A-Level Economics · Revision notes
2.5.3 Trade (business) cycle
Economies do not grow at a steady rate. Periods of rapid growth are followed by slowdowns, and sometimes by falls in output, before growth picks up again. This pattern is called the trade cycle, or business cycle. This topic covers what the cycle is and the characteristics of its two extremes: the boom and the recession.
The trade (business) cycle
The trade (business) cycle is the pattern of fluctuations in actual real GDP around the economy's long-term trend rate of growth.
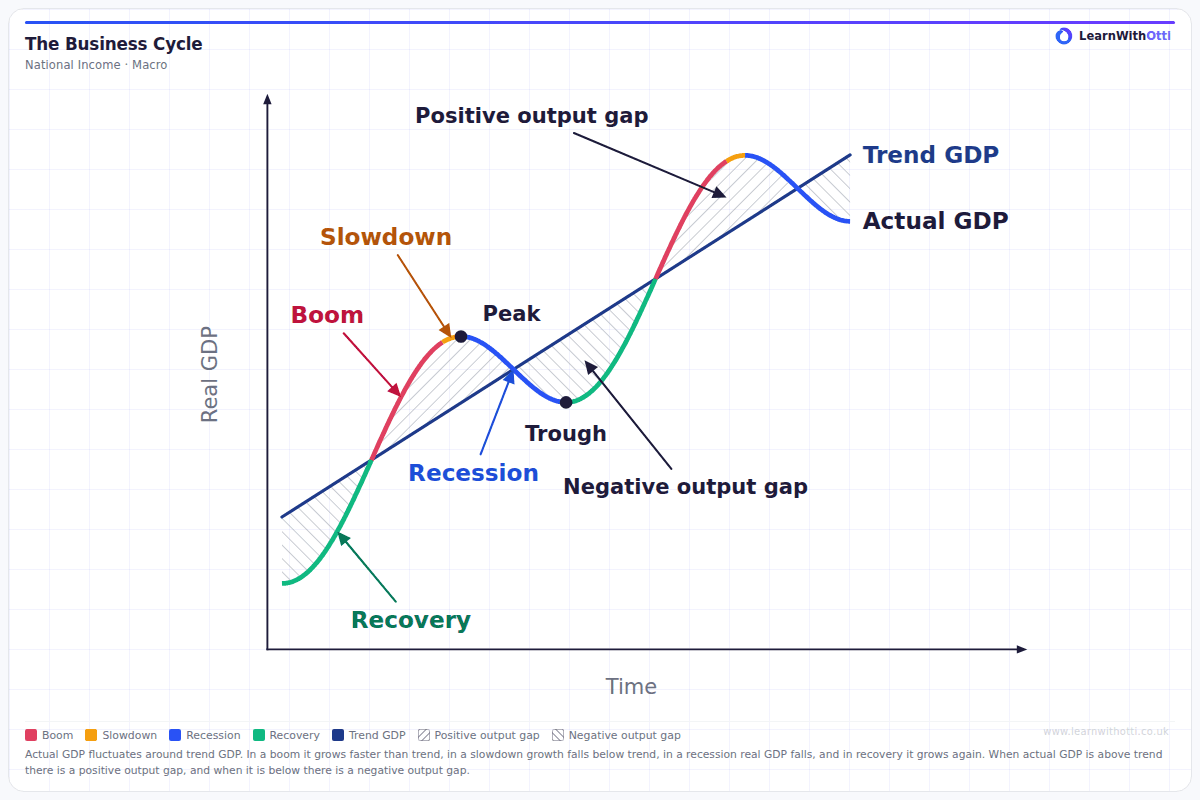
The cycle has four phases. Each one leads into the next for a reason.
- Boom. Real GDP grows faster than its trend rate and output rises above trend, so there is a positive output gap. Confidence is high, so households spend more and firms invest to meet rising sales. Through the multiplier, each rise in spending creates further income and further spending. As spare capacity is used up, firms compete for scarce workers and materials, so costs and prices start to rise.
- Slowdown (downturn). Growth is still positive but starts to fall. Rising costs squeeze profits, and higher inflation leads the Bank of England to raise interest rates, which makes borrowing more expensive. Households cut back on spending paid for by credit, and investment slows as firms decide they have enough capacity. Output is still above trend, but the positive output gap starts to close.
- Recession. Real GDP falls for at least two consecutive quarters, which is two quarters of negative economic growth. Firms facing weaker demand cut output and jobs, and the multiplier works in reverse: workers who lose their jobs spend less, which reduces sales for other firms. Falling confidence makes households save more and firms postpone investment. Output falls below trend and a negative output gap opens. The lowest point of the cycle is the trough.
- Recovery (upturn). Real GDP starts to grow again, but output is still below trend. Lower interest rates, lower costs and the need to replace worn-out machinery, cars and household goods encourage spending to pick up. Firms can use their spare capacity first, so output can rise quickly without much inflation. As confidence returns, the economy moves back towards trend and the cycle begins again.
The cycle is not regular. Diagrams draw it as a smooth, even wave so the phases are easy to see, but in reality booms and recessions vary in length and depth, and there is no fixed number of years between one peak and the next.
What drives the cycle
Key idea: Most fluctuations come from changes in aggregate demand (AD), which the multiplier then amplifies. A small change in spending can therefore lead to a much larger change in real GDP.
- Confidence. When households and firms are optimistic about future incomes and sales, consumption and investment rise. Higher spending raises incomes and sales, which makes people more confident still, so optimism can feed on itself. Keynes called these swings in mood animal spirits: decisions to spend and invest are driven partly by emotion and gut feeling, not just by careful calculation. When confidence falls, households save more and firms postpone investment, and the same process works in reverse.
- Interest rates and credit. Cheap and easily available credit lowers the cost of borrowing, so households borrow to buy houses, cars and other consumer durables, and firms borrow to invest. Higher interest rates raise the cost of new borrowing and of existing mortgage payments, which leaves households with less to spend. Changes in interest rates take time to affect spending, so their full effect may not be felt for a year or more.
- Asset prices. Rising house and share prices increase household wealth, so people feel better off and are more willing to spend, even if their income has not changed. This is the wealth effect. Rising house prices also let homeowners borrow more against the value of their homes. When asset prices fall, the effects reverse, and households may cut spending sharply to rebuild their savings.
- The world economy. A downturn in major trading partners such as the EU or the USA reduces their demand for UK exports. Lower exports reduce AD directly, and then reduce it further through the multiplier as exporting firms cut output and jobs. In this way a recession can spread from one country to another, as it did in 2008 and 2009.
- Supply shocks. A sharp rise in the price of oil or gas raises firms' costs of production, which shifts short-run aggregate supply (SRAS) to the left. The economy then faces higher inflation and lower real output at the same time. Higher energy bills also leave households with less to spend on other goods and services, which reduces AD as well. The rise in energy prices in 2022 is an example.
Characteristics of a boom
In a boom, actual growth is above trend and the economy is running close to, or beyond, its capacity.
- High growth in real GDP and a positive output gap. Actual output rises above its trend level as firms produce more than they could sustain in the long run, for example by paying overtime and running machinery for longer.
- Falling unemployment. Firms recruit more workers to meet rising demand, so cyclical unemployment falls. As the pool of unemployed workers shrinks, firms struggle to find people with the right skills, and skill shortages appear.
- Rising wages and costs. With fewer workers available, firms compete for them by offering higher wages. Demand for raw materials and components also rises, so their prices increase. Together, higher wages and input prices raise firms' costs of production.
- Rising inflation. Demand-pull inflation occurs because AD is growing faster than the economy's capacity to produce. Cost-push inflation follows as firms pass on higher wages and input costs as higher prices. Workers may then demand further pay rises to protect their real wages, which can lead to a wage-price spiral.
- High consumer and business confidence. Rising incomes and job security make households more willing to spend and borrow, so consumption grows strongly. Firms that expect sales to keep rising invest in new capacity, which adds further to AD through the multiplier.
- Rising asset prices, such as house and share prices. Strong demand for houses, together with easy credit, pushes up house prices, and rising company profits push up share prices. Higher asset prices increase wealth and confidence, which encourages even more spending through the wealth effect.
- Improving public finances. Tax revenues rise automatically as incomes, spending and profits rise, so the government collects more income tax, VAT and corporation tax. At the same time, spending on unemployment benefits falls as more people find work. The budget deficit therefore shrinks, or a surplus may appear. These automatic stabilisers take spending power out of the economy and help to slow the boom down.
- A worsening current account. When their incomes rise, UK consumers buy more goods and services from abroad, so spending on imports grows. Rising inflation can also make UK exports less price competitive. With imports growing faster than exports, the current account deficit tends to widen.
The UK in the late 1980s is a classic example. Strong growth in consumer spending and house prices was followed by inflation rising to around 10% by 1990.
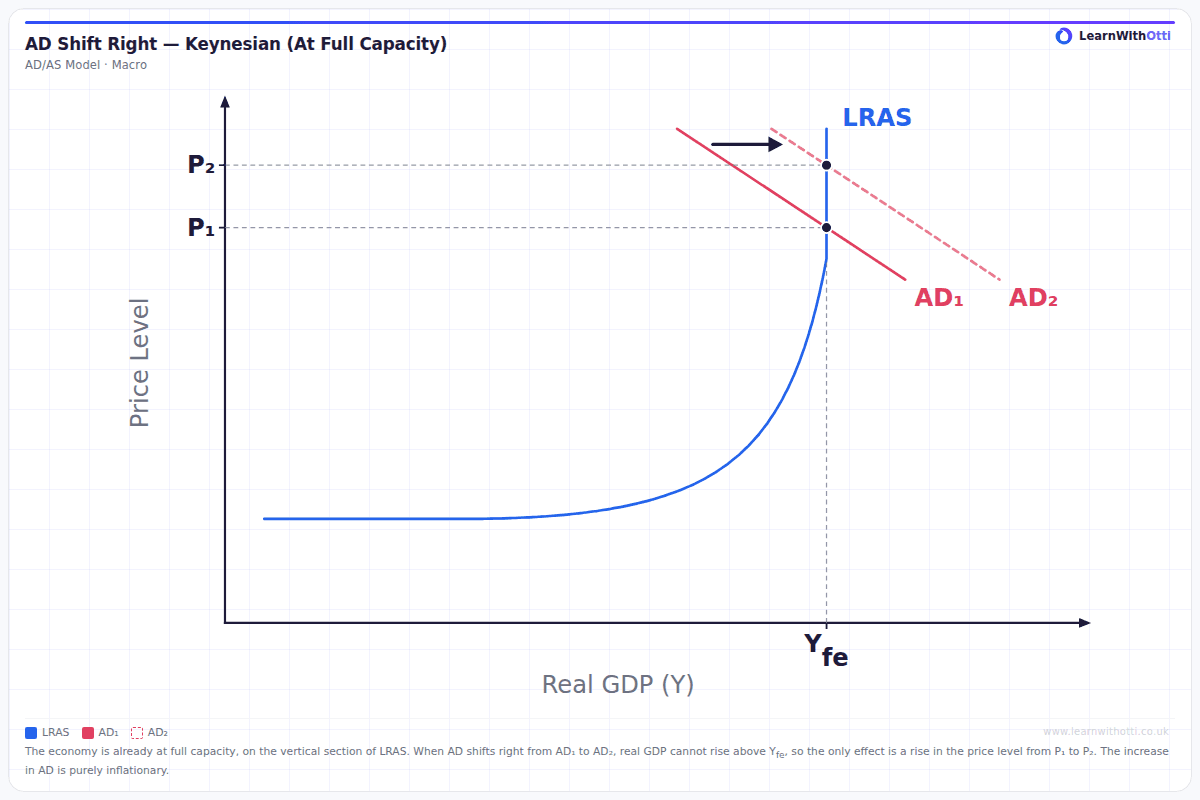
When AD keeps rising once the economy is already at full capacity, real GDP cannot rise any further. The increase in AD only pushes up the price level, so the result is demand-pull inflation with no extra output.
Characteristics of a recession
A recession is commonly defined in the UK as two consecutive quarters of negative growth in real GDP.
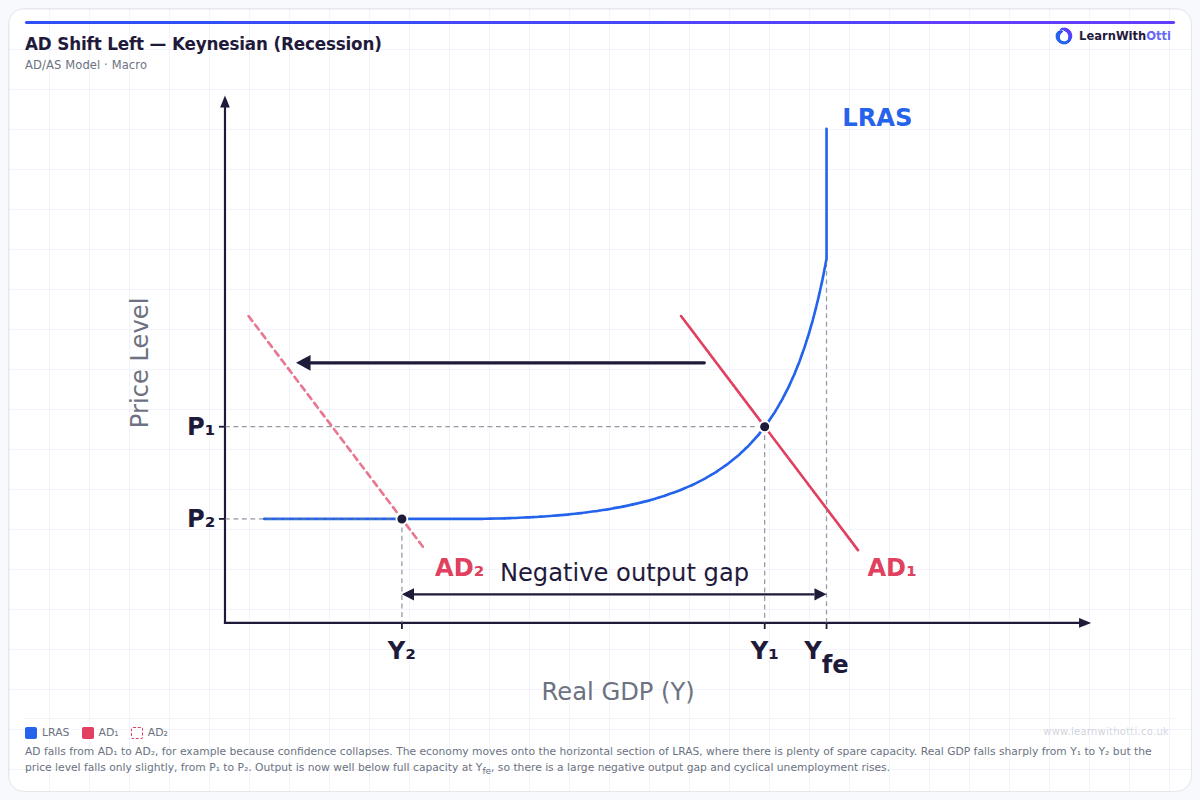
When AD falls and the economy moves onto the horizontal section of LRAS, real GDP falls sharply but the price level falls only slightly, because there is now plenty of spare capacity. Output is well below full capacity, so a large negative output gap opens up.
- Falling real output and a negative output gap. As AD falls, firms cut production to avoid building up unsold stock. Through the multiplier, each cut in spending reduces other people's incomes, so output falls by more than the first drop in demand. Actual output falls below its trend level, leaving workers and machinery idle.
- Rising unemployment, especially cyclical unemployment. Labour is a derived demand, so when firms produce less they need fewer workers. Firms usually cut overtime and stop recruiting first, then make workers redundant. Young people leaving education find it harder to get a first job.
- Falling inflation, and occasionally deflation. With weak demand and spare capacity, firms cut prices or offer discounts to win sales, and workers are in a weak position to push for pay rises. Slower wage growth keeps firms' costs down, so cost-push pressure eases as well. If the price level actually falls, there is deflation.
- Low consumer and business confidence. Fear of losing their jobs makes households save more and delay buying big items such as cars and furniture. Firms that expect sales to stay weak postpone investment, because they already have spare capacity. Lower spending reduces AD further, which can deepen the recession.
- Business failures, as sales and profits fall. Firms with high debts or thin profit margins may be unable to pay their bills, especially if banks become less willing to lend. Each failure means lost jobs and lost orders for suppliers, which spreads the damage to other firms.
- Worsening public finances. Tax revenues fall automatically because incomes, spending and profits are lower, so the government collects less income tax, VAT and corporation tax. At the same time, spending on unemployment and other welfare benefits rises. The budget deficit widens and government borrowing increases. These automatic stabilisers support AD and help to cushion the recession.
- An improving current account. Lower incomes mean households spend less on imports. If UK inflation falls below that of other countries, UK exports may also become more price competitive. The current account deficit therefore tends to narrow, although weak demand abroad can reduce exports too.
The UK went into recession in 2008 to 2009 after the global financial crisis, and in 2020, when restrictions during the coronavirus pandemic caused the largest annual fall in output for around three centuries.
Recession, slowdown and recovery
Key distinction: A slowdown is not a recession. If growth falls from 3% to 1%, output is still rising. A recession means output is actually falling, and it is usually defined as two consecutive quarters of negative economic growth.
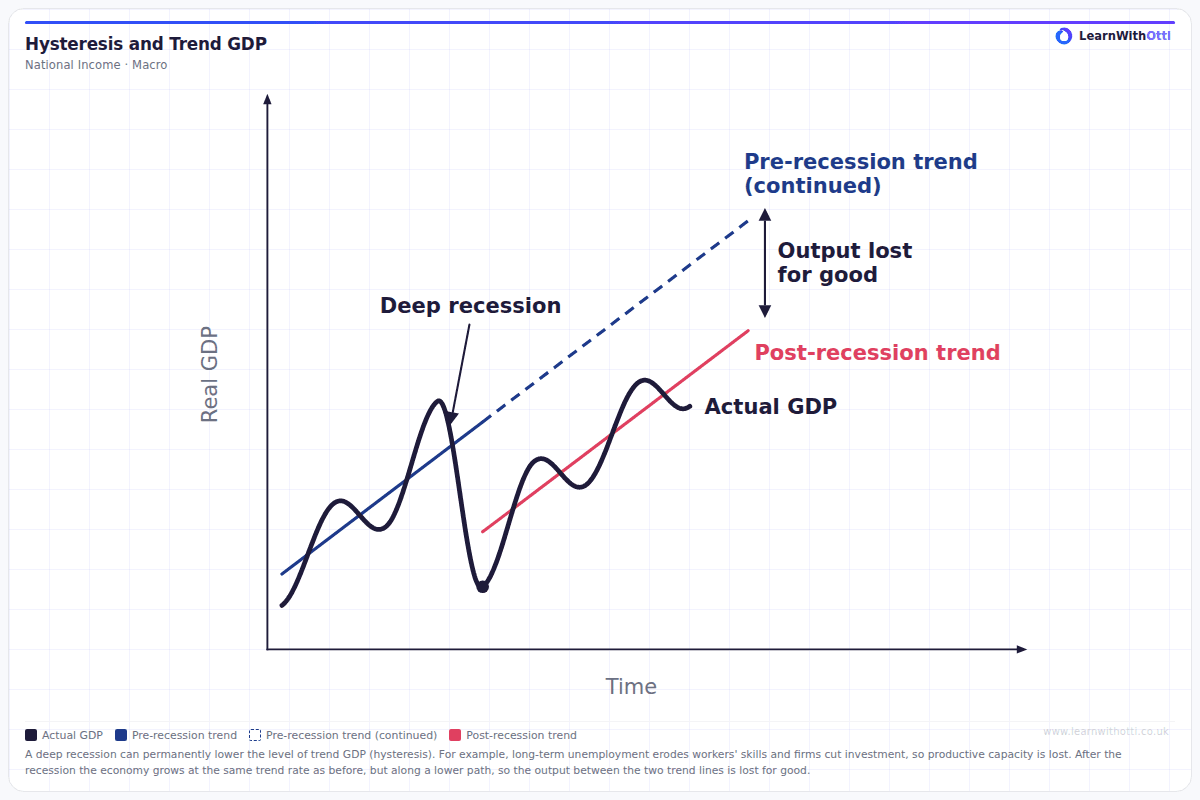
Recovery can be slow. Unemployment often keeps rising for some time after output starts to grow, because firms wait to be sure that demand has returned before they recruit. A deep recession can also cause lasting damage. This is called hysteresis: a fall in AD that lasts long enough reduces the economy's productive capacity, so the effects of the recession continue even after demand has recovered. Workers who are unemployed for a long time lose skills, confidence and contacts with employers, so they find it harder to get back into work, and some leave the labour force altogether. Investment that was postponed during the recession is never made, so the capital stock is smaller than it would otherwise have been. As a result, trend GDP grows at the same rate as before but from a lower level, and the output lost in the recession is never recovered.
Key terms
| Term | Meaning |
|---|---|
| Trade (business) cycle | Fluctuations in actual real GDP around its long-term trend |
| Boom | A period of fast growth with output above trend |
| Downturn | A period in which growth slows |
| Recession | Two consecutive quarters of negative growth in real GDP |
| Recovery | A period in which growth resumes after a recession |
| Trend growth | The long-term average rate of growth of productive capacity |
| Cyclical unemployment | Unemployment caused by a lack of aggregate demand |
| Hysteresis | When a deep recession permanently reduces productive capacity, so trend GDP continues from a lower level |
Common mistakes
- Treating a slowdown as a recession. Slower growth is still growth. A recession needs real output to fall.
- Drawing a regular cycle. Real cycles vary in length and depth.
- Listing characteristics without linking them. Explain why, for example, a boom causes inflation: firms face labour shortages and rising costs, and demand exceeds what the economy can sustainably supply.
- Forgetting the public finances and the current account. Both move with the cycle.
- Mixing up the cycle and the trend. The cycle is the fluctuation around trend, while the trend reflects growth in productive capacity.
How this has been examined
This topic has not appeared as a standalone question in the Edexcel papers indexed on this site.
Where this goes next
The gap between actual output and trend is analysed in 2.5.2 Output gaps, and the effects of growth in 2.5.4 The impact of economic growth. The links to unemployment and inflation are covered in 2.1.3 Employment and unemployment and 2.1.2 Inflation. Policies used to smooth the cycle are covered in 2.6.2 Demand-side policies, and the effect of the cycle on government borrowing in 4.5.3 Public sector finances.
Otti is an AI tutor built for A-Level students. Ask it anything, practise exam questions, and get instant feedback written like an examiner would give it — not just right or wrong, but why.
Get one answer marked free