Edexcel A-Level Economics · Revision notes
1.2.9 Indirect taxes and subsidies
Governments change the prices consumers pay by taxing some goods and subsidising others. This topic uses supply and demand, together with elasticity, to work out who actually bears a tax, who gains from a subsidy, and what each costs or raises for the government.
Indirect taxes
An indirect tax is a tax on spending, collected from firms, which pass some or all of it on to consumers in higher prices. VAT, fuel duty and alcohol duty are examples. (A direct tax, such as income tax, is levied on income instead.)
There are two types:
- A specific tax (or unit tax) is a fixed amount per unit sold, such as a set number of pence per litre of fuel. The supply curve shifts up by the amount of the tax, parallel to the original.
- An ad valorem tax is a percentage of the price, such as VAT at 20%. Because the tax is larger at higher prices, the supply curve shifts up by more at higher prices and pivots away from the original.
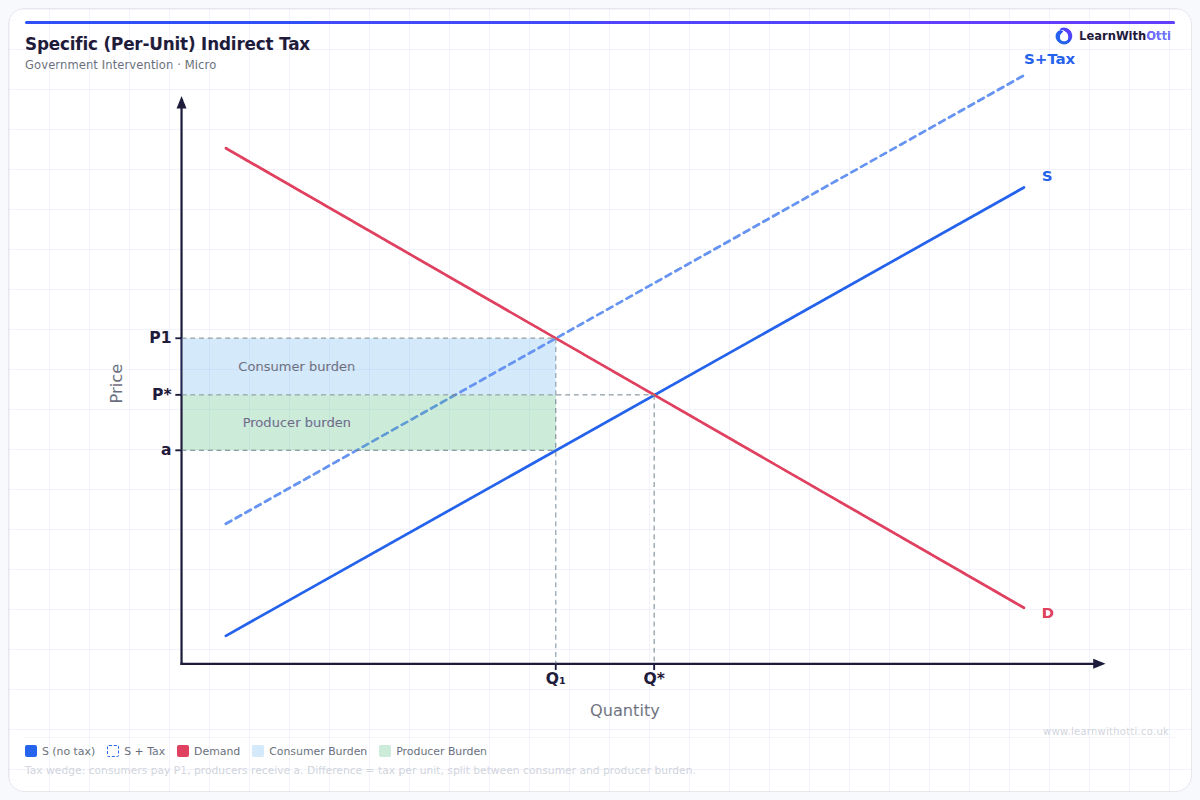
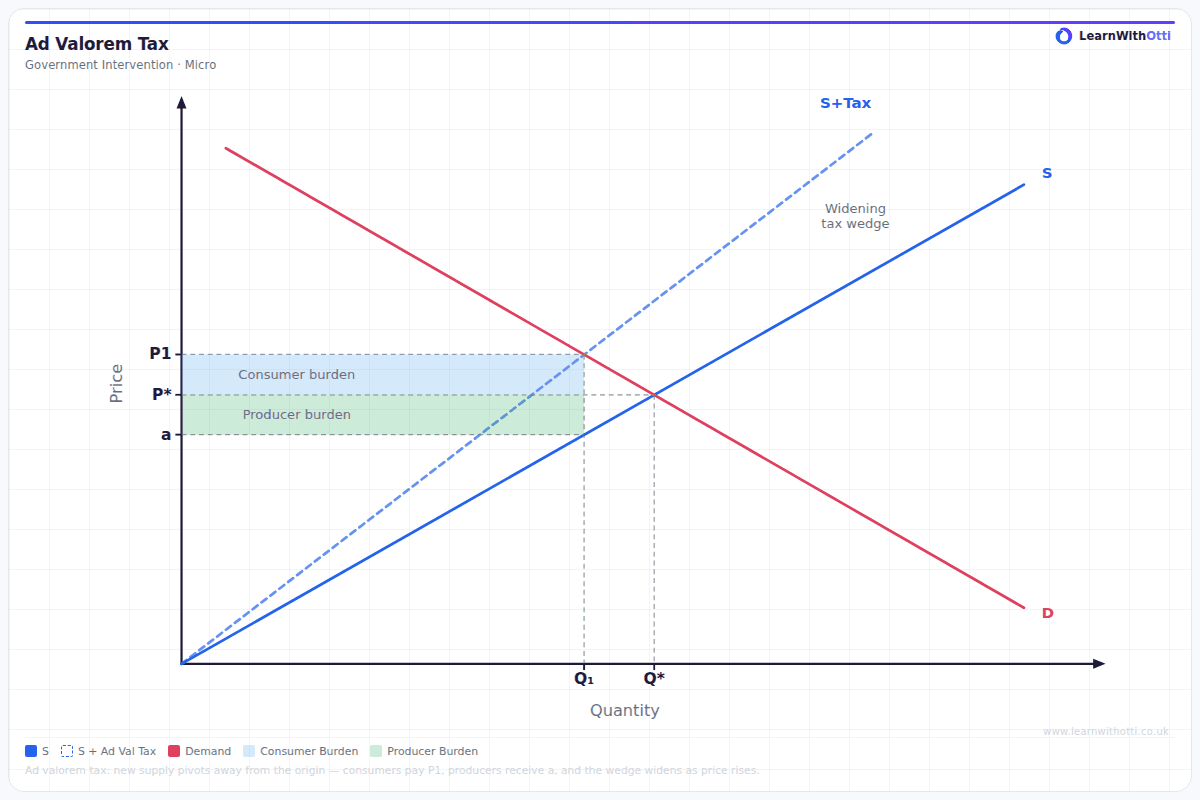
In both cases the tax adds to firms' costs, so the supply curve shifts upwards (to the left). Price rises and quantity falls.
The incidence of an indirect tax
Key idea: The incidence of a tax is how its burden is shared between consumers and producers. It is rarely split evenly.
On a diagram, the tax per unit is the vertical distance between the two supply curves at the new quantity. That distance divides into two parts:
- Consumer incidence: the rise in price consumers pay, from the original equilibrium price up to the new price.
- Producer incidence: the fall in what producers keep per unit, from the original price down to the new price minus the tax.
Multiplying each by the new quantity gives the total burden on each group. Together they make up the government's tax revenue: the tax per unit multiplied by the new quantity.
How elasticity decides the split
- Inelastic demand: consumers keep buying even when the price rises, so firms can pass most of the tax on. The consumer incidence is high. This is why governments tax goods such as fuel, tobacco and alcohol, which raise reliable revenue.
- Elastic demand: consumers switch away if the price rises, so firms must absorb most of the tax themselves. The producer incidence is high.
A worked example: a tax
A specific tax of £2 per unit is placed on a good. Before the tax, 1,000 units sell at £5. After the tax, the price rises to £6.50 and 800 units are sold.
| Per unit | Total (× 800 units) | |
|---|---|---|
| Consumer incidence | £6.50 − £5.00 = £1.50 | £1,200 |
| Producer incidence | £5.00 − £4.50 = £0.50 | £400 |
| Tax revenue | £2.00 | £1,600 |
Producers receive £6.50 from consumers but pass £2 to the government, so they keep £4.50 per unit, £0.50 less than before. Consumers bear three-quarters of this tax, which suggests demand for the good is price inelastic.
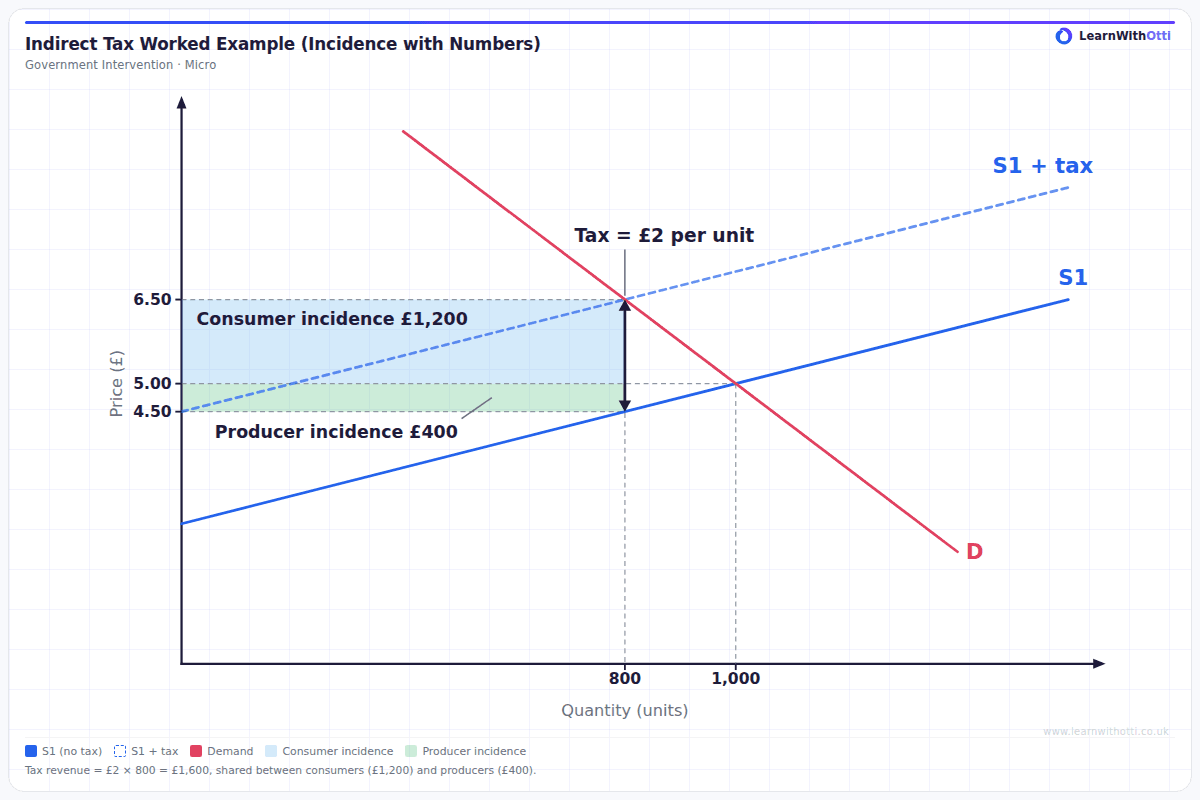
The impact of an indirect tax
- Consumers pay a higher price and buy less.
- Producers receive less per unit after tax and sell less, so revenue and profit fall. Some workers may lose their jobs if output falls far enough.
- Government gains tax revenue, which it can spend elsewhere. If the good causes harm, the fall in consumption may also be a benefit.
Subsidies
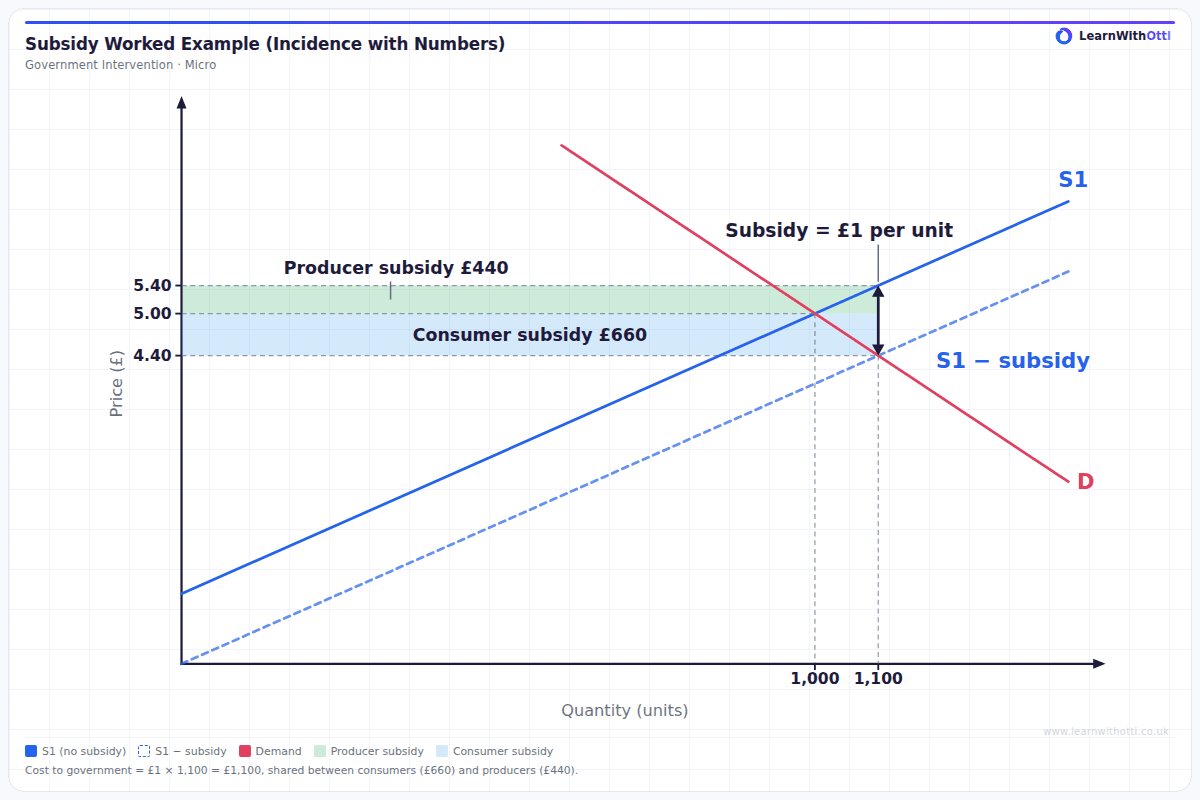
A subsidy is a payment from the government to producers, usually per unit produced, that lowers their costs. The supply curve shifts down (to the right) by the amount of the subsidy. Price falls and quantity rises.
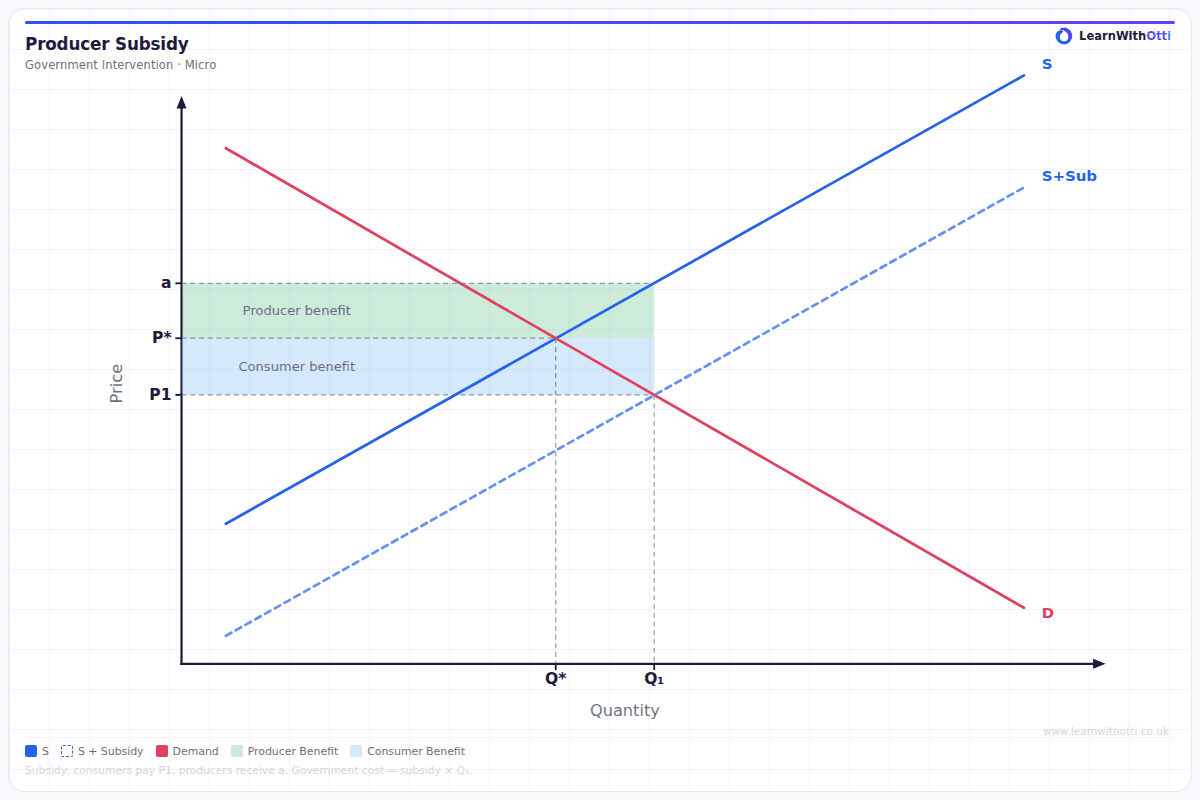
The subsidy per unit is the vertical distance between the two supply curves at the new quantity. It splits in the same way as a tax, but as a gain:
- The consumer subsidy: the fall in price consumers pay, from the original price down to the new price. On the diagram, it is the rectangle between those two prices, across the new quantity.
- The producer subsidy: the rise in what producers receive per unit, from the original price up to the new price plus the subsidy. It is the rectangle between those two prices, across the new quantity.
Together the two rectangles equal the total cost of the subsidy to the government: the subsidy per unit multiplied by the new quantity.
Elasticity decides the split here too. When demand is inelastic, most of the subsidy is passed on to consumers as lower prices. When demand is elastic, producers keep more of it.
A worked example: a subsidy
A subsidy of £1 per unit is given to producers. Before it, 1,000 units sell at £5. After it, the price falls to £4.40 and 1,100 units are sold.
| Per unit | Total (× 1,100 units) | |
|---|---|---|
| Consumer subsidy | £5.00 − £4.40 = £0.60 | £660 |
| Producer subsidy | £5.40 − £5.00 = £0.40 | £440 |
| Cost to government | £1.00 | £1,100 |
Producers receive £4.40 from consumers plus £1 from the government, so £5.40 per unit, £0.40 more than before.
The impact of a subsidy
- Consumers pay a lower price and buy more.
- Producers receive more per unit and sell more, so revenue and profit rise.
- Government bears the full cost of the subsidy, which has an opportunity cost: the money cannot be spent on anything else, or it must be raised through taxes or borrowing.
Key terms
| Term | Meaning |
|---|---|
| Indirect tax | A tax on spending, collected from firms |
| Specific tax | A fixed amount of tax per unit sold |
| Ad valorem tax | A tax set as a percentage of the price |
| Incidence | How the burden of a tax is shared between consumers and producers |
| Subsidy | A payment from government to producers that lowers their costs |
| Consumer subsidy | The fall in price consumers pay as a result of a subsidy |
| Producer subsidy | The rise in revenue per unit producers keep as a result of a subsidy |
Common mistakes
- Shifting the demand curve. Taxes and subsidies on producers shift the supply curve, not demand.
- Assuming the price rises by the full tax. It only does so if demand is perfectly inelastic. Normally the price rises by less than the tax.
- Measuring incidence at the old quantity. The tax per unit and both incidence rectangles are measured at the new, post-tax quantity.
- Drawing an ad valorem tax as a parallel shift. A percentage tax produces a supply curve that diverges from the original as price rises.
- Forgetting the government in a subsidy. Its cost is the subsidy per unit times the new quantity, and it has an opportunity cost.
How this has been examined
In the Edexcel papers indexed on this site, this topic has appeared in five formats:
- 5-mark "Explain" data response — asked twice across 2 series (2020 to 2025)
- 4-mark "Draw" diagram — asked once (2020)
- 4-mark "Explain" data response — asked once (2025)
- 2-mark calculation — asked twice across 2 series (2017 to 2021)
- 1-mark calculation — asked twice in one series (2017)
Where this goes next
The elasticity concepts that decide incidence are in 1.2.3 Price, income and cross elasticities of demand and 1.2.5 Elasticity of supply, and the supply shifts in 1.2.4 Supply. Using taxes and subsidies to correct market failure is covered in 1.4.1 Government intervention in markets, and the ways intervention can go wrong in 1.4.2 Government failure. The wider role of taxation in the economy is in 4.5.2 Taxation.
Otti is an AI tutor built for A-Level students. Ask it anything, practise exam questions, and get instant feedback written like an examiner would give it — not just right or wrong, but why.
Get one answer marked free