Edexcel A-Level Economics · Revision notes
2.2.1 The Characteristics of AD
Aggregate demand (AD) is the total planned spending on an economy's goods and services at a given price level over a period of time. It is the demand side of the macroeconomic model, and almost every question about growth, unemployment and inflation involves it.
The components of AD
AD = C + I + G + (X − M)
- C, consumption: spending by households on goods and services.
- I, investment: spending by firms on capital goods, such as machinery, buildings and equipment.
- G, government spending: spending by government on goods and services, such as wages of public sector workers and building roads and hospitals. Transfer payments such as pensions and benefits are not included, because they are not payments for output.
- X − M, net trade: exports minus imports. Exports are spending by foreigners on UK output, so they add to AD. Imports are spending by UK residents on foreign output, so they are subtracted.
The relative importance of the components
The components are very different in size.
- Consumption is by far the largest, at around 62% of UK GDP. Changes in household spending have the biggest effect on AD.
- Government spending on goods and services is around 21%.
- Investment is around 19%, but it is the most volatile component. Because it depends heavily on business confidence, it can rise or fall sharply.
- Net trade is small relative to the others, at around −1% of GDP. It has usually been negative for the UK, although exports and imports are each large.
These shares are approximate recent figures and change a little from year to year. What matters is that consumption is by far the largest component.
Key distinction: Size and volatility both matter. A small change in consumption can move AD more than a large change in a smaller component, but investment's volatility makes it a frequent source of fluctuations in the economic cycle.
The AD curve
The AD curve plots the real output demanded against the price level. It slopes downwards from left to right: a fall in the price level raises the quantity of real output demanded.
Three reasons explain the slope:
- The wealth effect. A lower price level raises the real value of people's money and savings, so they feel wealthier and spend more.
- The interest rate effect. A lower price level means people need less money for transactions, so interest rates tend to fall, encouraging borrowing to spend and invest.
- The international trade effect. A lower UK price level makes UK goods cheaper relative to foreign goods, so exports rise and imports fall.
Movements along and shifts of the AD curve
A movement along the AD curve is caused only by a change in the price level. A rise in the price level causes a contraction in the real output demanded; a fall causes an extension.
A shift of the AD curve is caused by a change in any component of AD at a given price level.
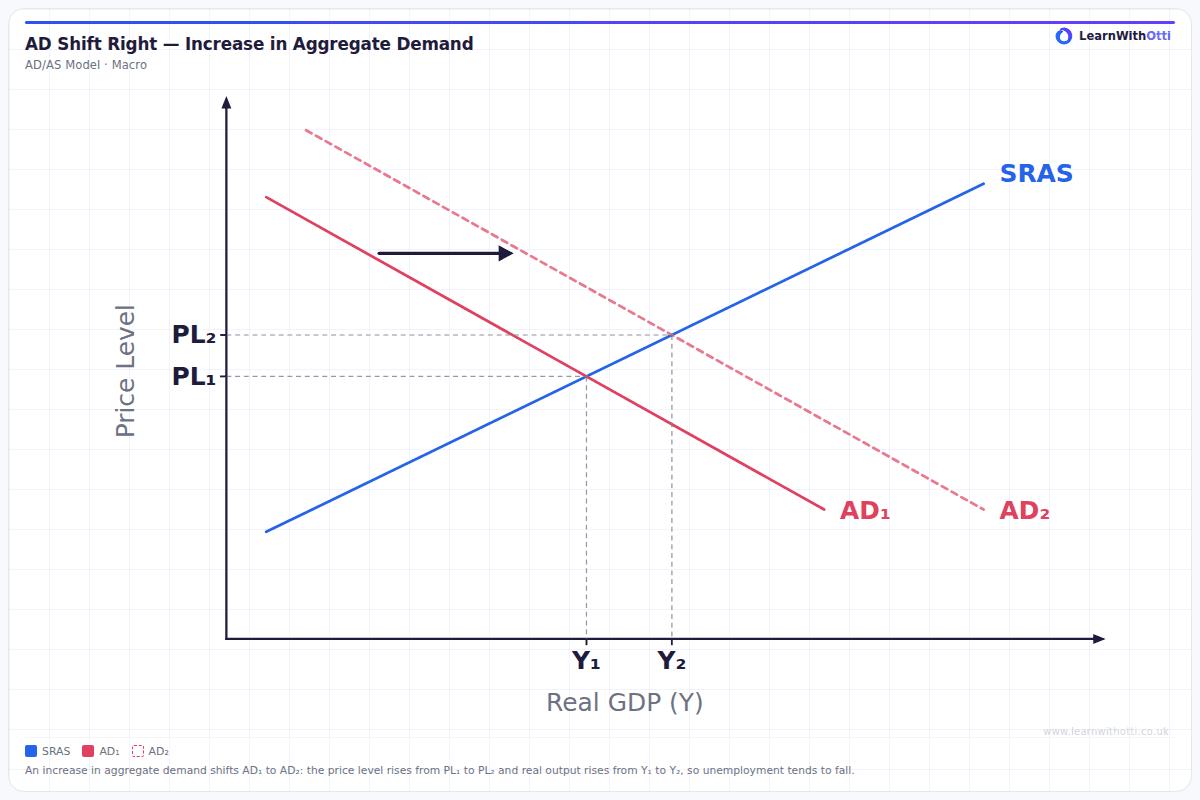
AD shifts right when, for example:
- consumer confidence or household wealth rises;
- interest rates are cut, encouraging borrowing for consumption and investment;
- income tax is cut, raising disposable income;
- government spending increases;
- demand for exports rises, or the exchange rate depreciates.
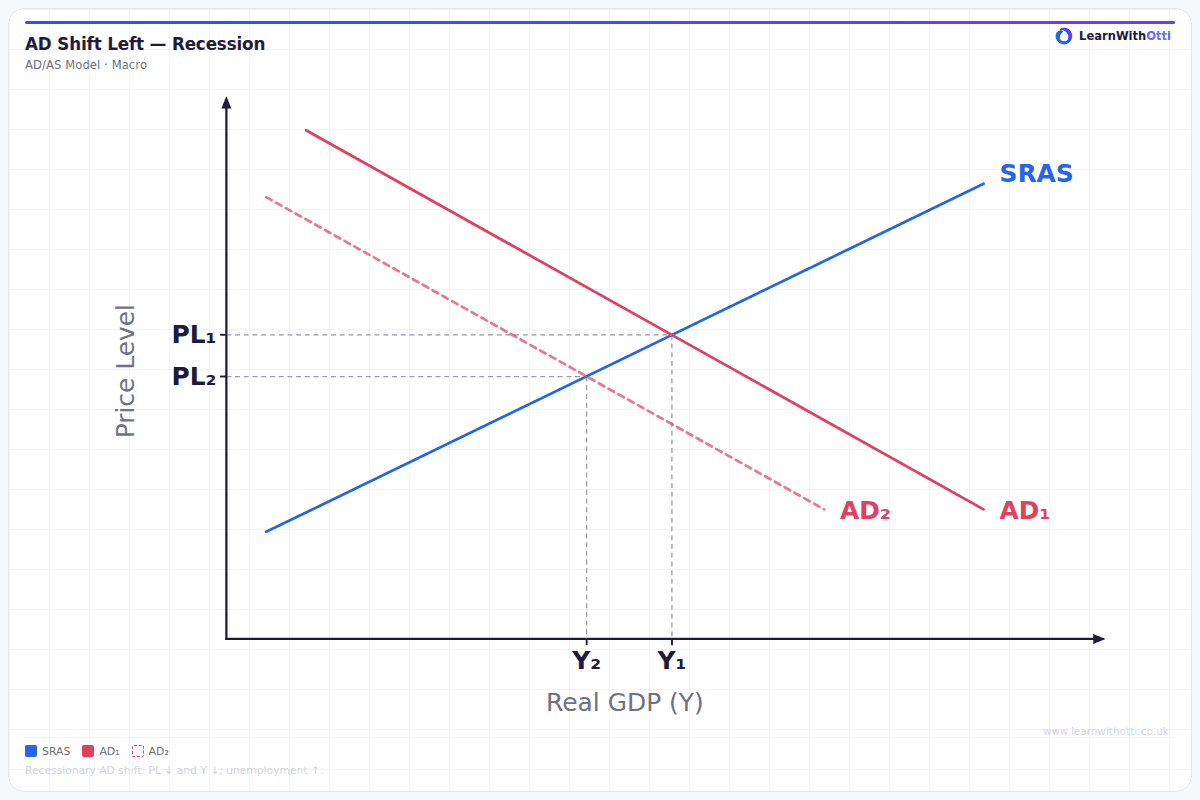
AD shifts left for the opposite reasons, such as a rise in interest rates, a fall in confidence, or a recession in a major trading partner.
Watch out: The distinction matters because the cause determines the diagram. A change in the price level cannot shift the AD curve, since the price level is on the axis.
Key terms
| Term | Meaning |
|---|---|
| Aggregate demand | Total planned spending on an economy's goods and services at a given price level |
| Consumption | Household spending on goods and services |
| Investment | Firms' spending on capital goods |
| Government spending | Government spending on goods and services, excluding transfer payments |
| Net trade | Exports minus imports |
| Wealth effect | The change in spending when the real value of wealth changes with the price level |
| Shift in AD | A change in AD at every price level, caused by a change in a component |
Common mistakes
- Including transfer payments in G. Pensions and benefits are not spending on output; they affect AD only when recipients spend them, through C.
- Adding imports instead of subtracting them. Imports are spending on foreign output and reduce AD.
- Shifting AD for a change in the price level. A price level change is a movement along the curve.
- Using microeconomic reasons for the slope. The AD curve slopes down for macroeconomic reasons, not because individual consumers substitute between goods.
- Treating the largest component as the most volatile. Consumption is largest; investment is the most volatile.
How this has been examined
In the Edexcel papers indexed on this site, this topic has appeared in two formats:
- 12-mark "Discuss" data response — asked once (2024)
- 1-mark multiple choice — asked once (2018)
Where this goes next
Each component has its own topic: 2.2.2 Consumption (C), 2.2.3 Investment (I), 2.2.4 Government expenditure (G) and 2.2.5 Net trade (X-M). AD is combined with aggregate supply to find equilibrium output in 2.4.3 Equilibrium levels of real national output, and the way an initial change in AD is amplified is covered in 2.4.4 The multiplier.
Otti is an AI tutor built for A-Level students. Ask it anything, practise exam questions, and get instant feedback written like an examiner would give it — not just right or wrong, but why.
Get one answer marked free