Edexcel A-Level Economics · Revision notes
2.1.1 Economic Growth
What the specification covers
In our own words — not the official specification wording
Measuring the growth of an economy using real GDP, the other income measures used alongside it, how countries are compared fairly, and why these figures are an imperfect guide to how well people live.
- Using the percentage change in real GDP as the standard measure of how fast an economy is growing.
- Being able to tell these pairs of measures apart:
- Figures adjusted for inflation compared with figures at current prices.
- The economy's total output compared with output divided by the population.
- Output measured in money terms compared with output measured in quantity of goods.
- Further ways of measuring a nation's income:
- Income earned by a country's residents wherever in the world it was earned.
- Setting growth rates side by side across different countries and across different time periods.
- Adjusting figures so that a given sum buys the same basket of goods in each country before comparing them.
- The reasons GDP figures give an incomplete picture of living standards, whether comparing countries or looking back over time.
- Measuring how well a population is actually doing:
- The official measures of wellbeing collected in the UK.
- Whether rising incomes actually make people feel better off.
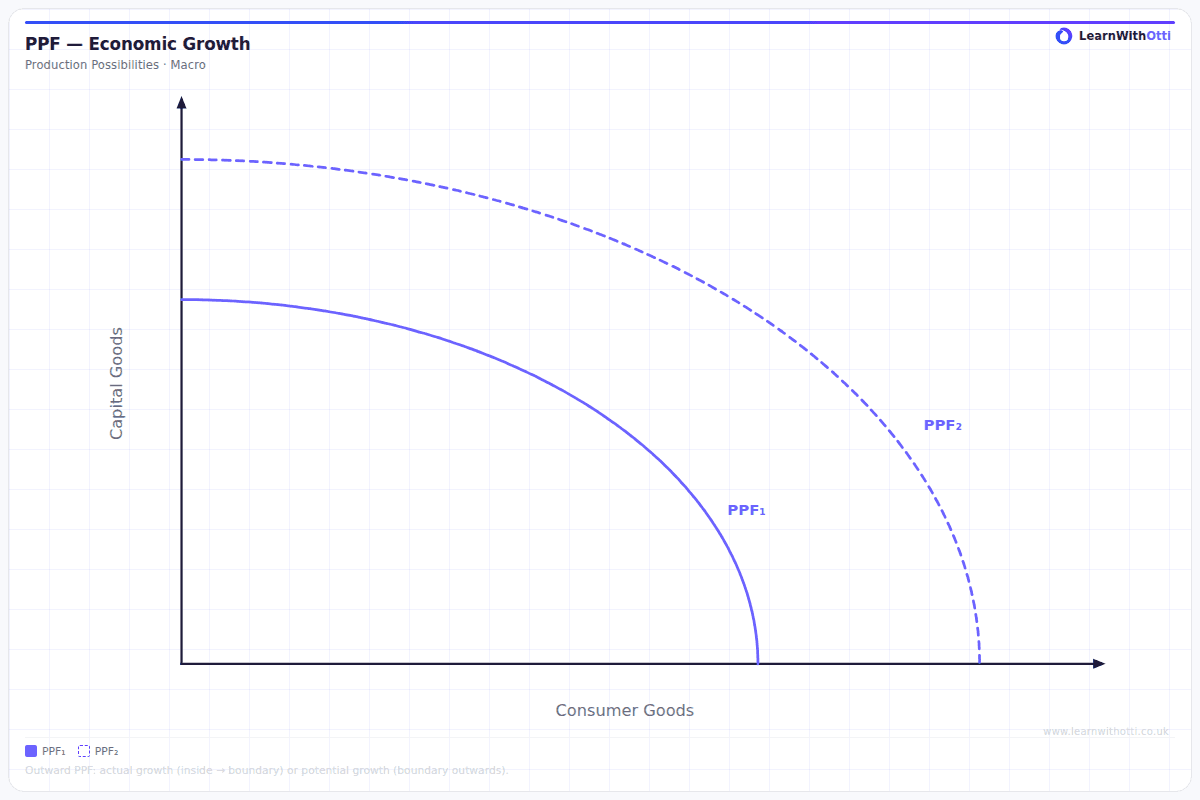
Economic growth means an increase in the productive output of an economy, and the standard measure of it is the percentage change in real GDP. This topic is where Theme 2 begins, and the detail matters: several of the terms below are easy to confuse and describe genuinely different things.
Real GDP and the growth rate
GDP is the total value of goods and services produced in an economy over a period of time. The growth rate is the percentage change in real GDP from one period to the next.
Key idea: The word real is doing essential work. Nominal GDP can rise simply because prices rose, without a single extra good being produced. Real GDP strips inflation out, so a rise means the economy genuinely produced more.
Three distinctions the specification expects you to hold apart:
- Real versus nominal. Real is adjusted for inflation; nominal is measured at the prices of the day.
- Total versus per capita. Total GDP is the whole economy's output. GDP per capita divides that by the population, and it is the better guide to the average person's material standard of living. An economy can grow 2% while GDP per capita falls, if the population grows faster.
- Value versus volume. Value is output measured in money; volume is output measured in quantity. The same volume of cars sold at higher prices raises value but not volume.
Other measures of national income
- GNI (Gross National Income) measures income earned by a country's residents wherever in the world it was earned, rather than income generated inside the country's borders.
- GNP is the same idea expressed as output.
The gap between GDP and GNI matters in practice. Ireland's GDP is inflated by the profits of multinational firms based there, much of which flows abroad; its GNI is markedly lower and describes Irish living standards far better. The distinction is not a technicality: for some economies, GDP and GNI describe noticeably different things.
Worked example: calculating a growth rate
An economy has nominal GDP of £2,600bn in 2024. The GDP deflator is 100 in 2023 and 103 in 2024. Real GDP in 2023 was £2,480bn. The population grew by 0.8%.
Step 1 — convert nominal to real. Real GDP 2024 = 2,600 ÷ (103 ÷ 100) = £2,524bn
Step 2 — calculate the real growth rate. (2,524 − 2,480) ÷ 2,480 × 100 = 1.8%
Step 3 — adjust for population. Growth in GDP per capita ≈ 1.8% − 0.8% = 1.0%
Two errors account for most wrong answers: dividing by the later year's figure instead of the earlier one, and forgetting to multiply by 100.
Comparing countries fairly
Converting one country's GDP into another's currency at the market exchange rate distorts the comparison, because exchange rates move for reasons unconnected to living costs, and non-traded goods like haircuts and rent are far cheaper in poorer countries.
Purchasing power parity (PPP) adjusts the figures so that a given sum buys a comparable basket of goods in each country.
Key distinction: Comparisons of living standards across countries should always use PPP-adjusted figures. Comparisons over time within one country should always use real figures.
Why GDP is an imperfect guide to living standards
- It ignores distribution. Rising GDP per capita says nothing about who received the extra income.
- It misses unrecorded activity. The informal economy, cash work and unpaid household labour go uncounted, and both are proportionally larger in developing economies.
- It ignores what is produced. Output of weapons, prisons and clean-up after a flood all count the same as output of hospitals and food.
- It ignores external costs. Growth that pollutes a river adds to GDP twice: once for the output, and again for the clean-up.
- It ignores leisure and working conditions. An economy where people work 60-hour weeks may out-produce one where they work 35, without anyone being better off.
- Quality changes are hard to capture. A £500 phone today is a vastly better product than a £500 phone in 2010.
Measuring wellbeing instead
Because of those gaps, the ONS publishes measures of national wellbeing, which include life satisfaction, health, relationships and the environment alongside income.
The interesting economics here is the Easterlin paradox: within a country at a point in time, richer people report higher life satisfaction, but as a country grows richer over decades, average reported happiness rises far less than income does. Whether income raises wellbeing appears to depend partly on income relative to others, not on absolute income alone — so growth does not translate automatically into a happier population.
Key terms
| Term | Meaning |
|---|---|
| Real GDP | Output adjusted for inflation |
| Nominal GDP | Output measured at current prices |
| GDP per capita | GDP divided by population |
| GNI | Income earned by residents, wherever earned |
| Purchasing power parity | An adjustment making incomes comparable across countries |
| GDP deflator | A price index used to convert nominal figures into real ones |
| Easterlin paradox | Rising national income raises reported happiness far less than expected |
Common mistakes
- Confusing slower growth with a shrinking economy. If growth falls from 3% to 1%, the economy is still growing, just more slowly. Output only falls when growth is negative.
- Comparing nominal figures over time, or market-exchange-rate figures across countries.
- Treating GDP per capita as a measure of the typical person. It is a mean, and a mean is pulled upwards by high incomes.
- Treating GDP's limitations as universal. Which limitation matters most depends on the economy: unrecorded activity dominates in some, environmental cost or inequality in others.
How this has been examined
In the Edexcel papers indexed on this site, this topic has appeared in six formats:
- 1-mark multiple choice — asked 4 times across 3 series (2020 to 2025)
- 2-mark calculation — asked 3 times across 3 series (2020 to 2023)
- 2-mark "Explain" short answer — asked twice across 2 series (2020 to 2021)
- 4-mark "Explain" data response — asked once (2025)
- 5-mark "Explain" data response — asked once (2020)
- 10-mark "Assess" data response — asked twice across 2 series (2019 to 2022)
Where this goes next
This runs straight into 2.1.2 Inflation, which supplies the price indices used to convert nominal figures into real ones, and into 2.5.1 Causes of growth, which asks what actually drives the number calculated here. The limitations above reappear in 4.3.1 Measures of development, where GDP per capita sits alongside broader measures of how well a country is doing.
Otti is an AI tutor built for A-Level students. Ask it anything, practise exam questions, and get instant feedback written like an examiner would give it — not just right or wrong, but why.
Get one answer marked free