Edexcel A-Level Economics · Revision notes
1.2.3 Price, Income and Cross Elasticities of Demand
What the specification covers
In our own words — not the official specification wording
How responsive demand is to a change in price, to a change in income, and to a change in the price of another good: the formulae, how to read the numbers, what makes demand more or less responsive, and why it matters to firms and government.
- What each of the three demand elasticities measures.
- Applying the formula for each one.
- Reading what a calculated value actually tells you:
- Where the value sits on the scale from no response at all to an infinite response, and the dividing line where demand changes in exact proportion to price.
- Whether demand rises or falls as income rises, and how strongly — which separates inferior goods from normal goods and from luxuries.
- Whether two goods are bought instead of each other, alongside each other, or have no relationship.
- What makes demand for a good more or less responsive.
- Why these measures matter to firms and to government when it comes to:
- Placing a tax on a good, or paying a subsidy towards it.
- Incomes rising or falling once inflation is taken into account.
- A change in the price of a good bought instead of, or alongside, this one.
- How a price change feeds through to the money a firm takes, including working it out numerically.
Demand responds to more than price. It responds to income, and to the price of other goods. Elasticity is how economists measure the size of that response.
All three elasticities follow the same shape: the percentage change in quantity demanded, divided by the percentage change in whatever caused it.
Price elasticity of demand (PED)
PED = % change in quantity demanded ÷ % change in price
PED is negative for almost every good, because price and quantity move in opposite directions. Economists usually discuss the size of the number and leave the sign implied — but write the minus sign when you calculate it.
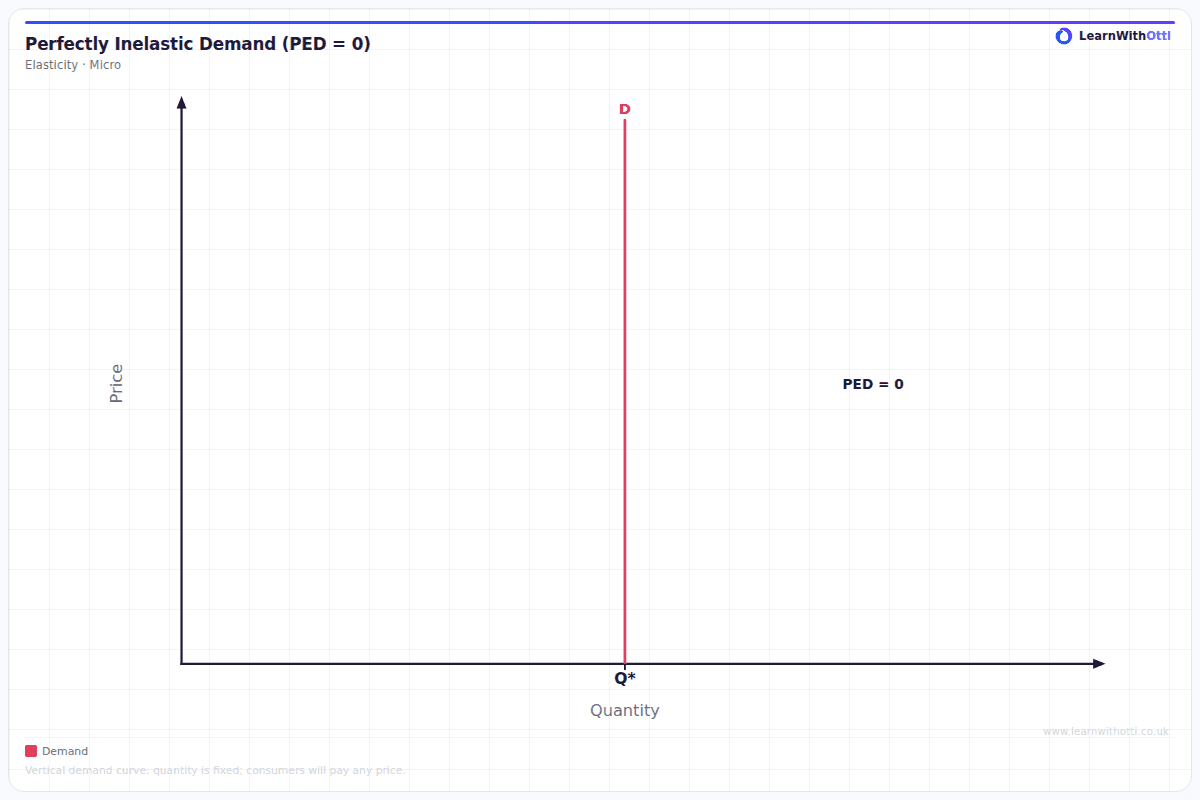
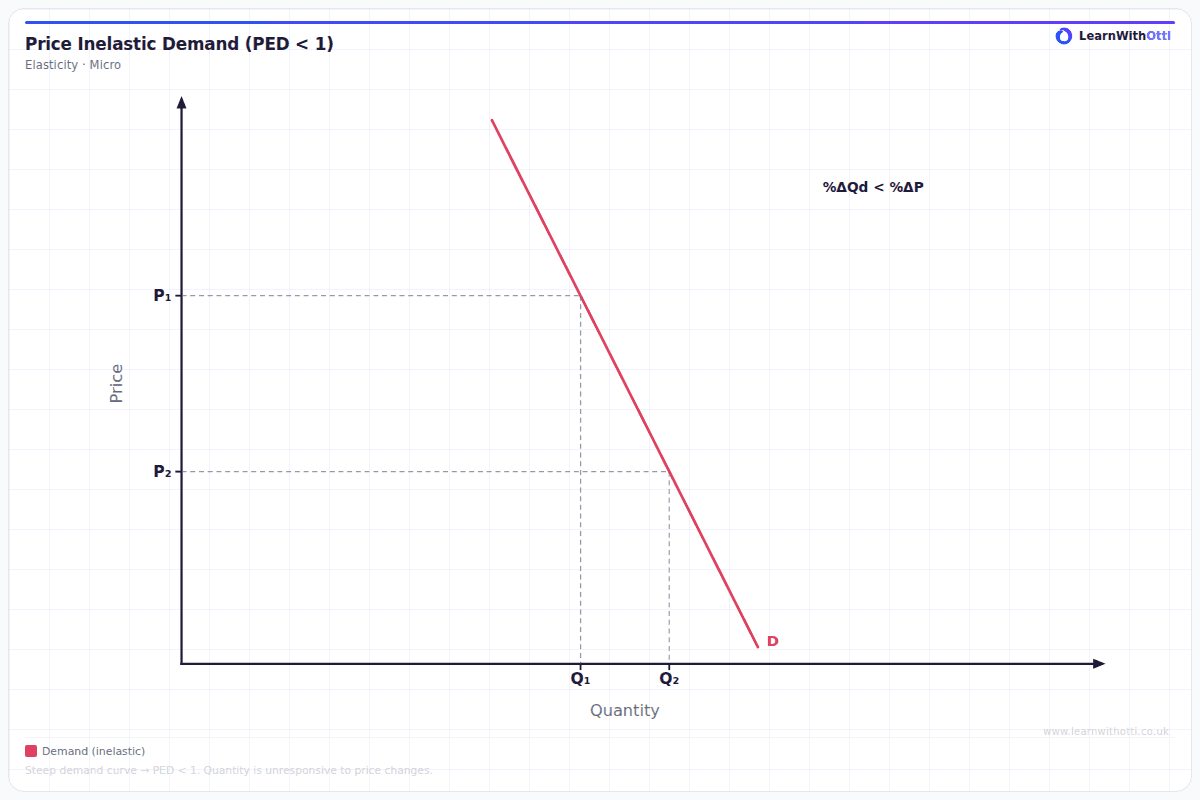
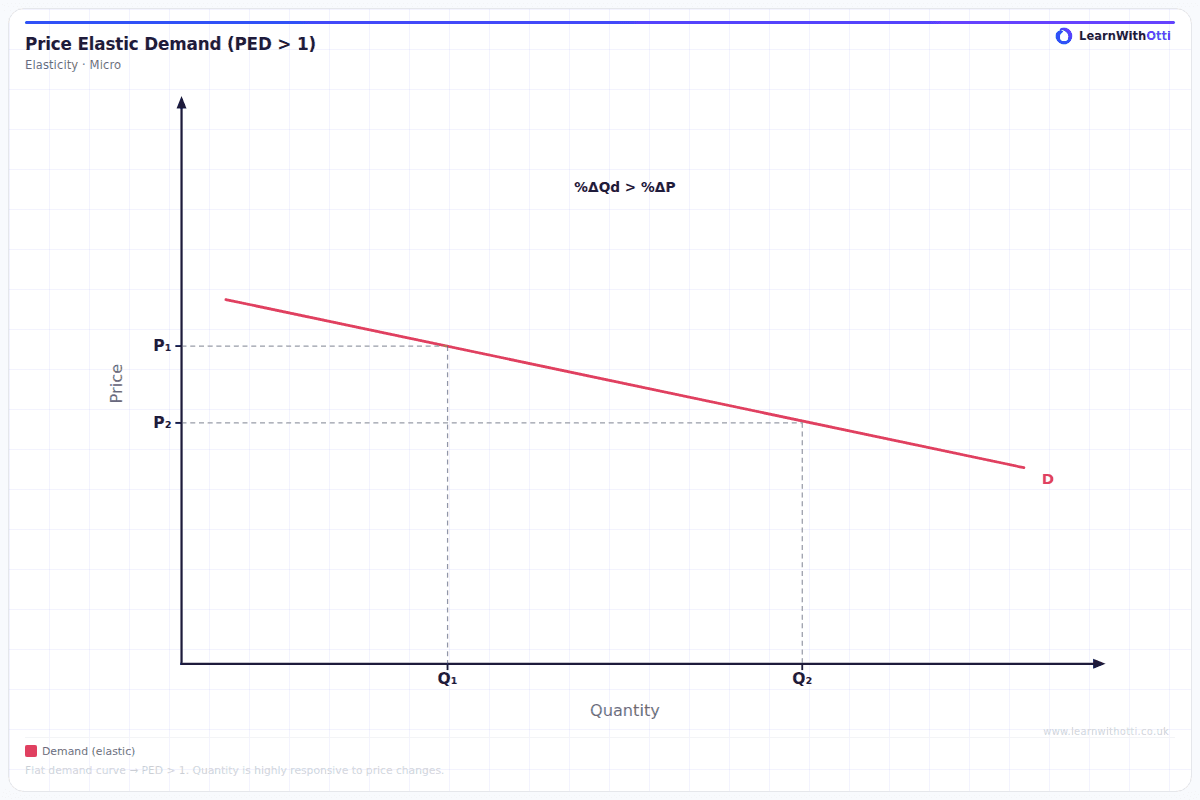
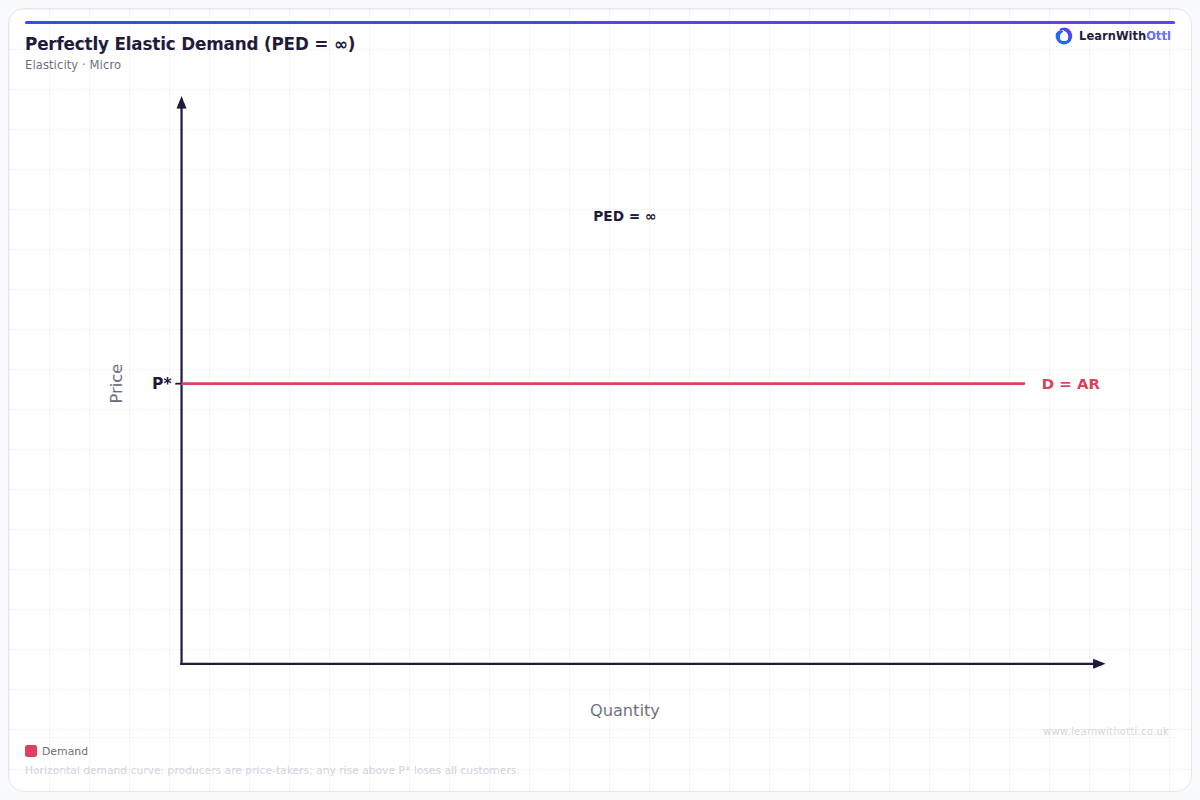
| Value | Name | Meaning |
|---|---|---|
| 0 | Perfectly inelastic | Quantity does not change at all |
| Between 0 and −1 | Relatively inelastic | Quantity changes proportionally less than price |
| −1 | Unitary elastic | Quantity changes in exact proportion to price |
| Below −1 | Relatively elastic | Quantity changes proportionally more than price |
| −∞ | Perfectly elastic | Any price rise sends demand to zero |
Worked example
A coffee shop raises the price of a latte from £3.00 to £3.30. Weekly sales fall from 500 to 440.
Step 1 — percentage change in quantity. (440 − 500) ÷ 500 × 100 = −12%
Step 2 — percentage change in price. (3.30 − 3.00) ÷ 3.00 × 100 = +10%
Step 3 — divide. PED = −12 ÷ 10 = −1.2
Demand is relatively elastic: the quantity response outweighs the price change.
Watch out: Always divide by the original value, not the new one. That single error accounts for many lost marks.
What determines PED
The determinants are usually remembered as SPLAT.
- S — Substitutes. The more close alternatives, the more elastic. This is the single most important determinant.
- P — Proportion of income. A good taking a tiny share of income, such as salt, is inelastic.
- L — Luxury or necessity. Necessities are more inelastic — people buy them whatever the price.
- A — Addictiveness or habit. Addictive goods are markedly inelastic, which is why they are taxed so heavily.
- T — Time. Demand is more elastic in the long run, because people find alternatives.
PED and total revenue
This is the application that matters most to firms.
Key idea: Total revenue = price × quantity. When price changes, those two move in opposite directions, so what happens to revenue depends on which effect is larger — which is exactly what PED measures.
| If demand is... | A price rise... | A price cut... |
|---|---|---|
| Relatively inelastic | raises total revenue | lowers total revenue |
| Relatively elastic | lowers total revenue | raises total revenue |
| Unitary elastic | leaves revenue unchanged | leaves revenue unchanged |
Check it against the worked example: revenue was 500 × £3.00 = £1,500, and after the rise 440 × £3.30 = £1,452. Demand was elastic, so the price rise cut revenue.
This explains a lot of real pricing behaviour. A train company raising peak fares and cutting off-peak fares is responding to different elasticities in the same market.
Income elasticity of demand (YED)
YED = % change in quantity demanded ÷ % change in real income
The sign is what classifies the good:
- Positive → a normal good: demand rises as income rises.
- Between 0 and +1 → a necessity: demand rises, but proportionally less than income.
- Above +1 → a luxury: demand rises proportionally more than income.
- Negative → an inferior good: demand falls as income rises. Supermarket value ranges and bus travel are the standard examples.
YED matters to firms planning for a recession. A business selling luxuries faces a sharp fall in demand when incomes drop; one selling inferior goods may see demand rise.
Cross elasticity of demand (XED)
XED = % change in quantity demanded of good A ÷ % change in price of good B
Again the sign classifies:
- Positive → substitutes. B gets dearer, so people switch to A. Butter and margarine.
- Negative → complements. B gets dearer, so people buy less of both. Printers and ink cartridges.
- Zero or near zero → unrelated goods.
The size indicates how strong the relationship is. An XED of +2.0 between two brands means they compete fiercely; +0.1 means they barely interact.
Why elasticity matters to government
- Indirect taxes. A tax on an inelastic good raises substantial revenue and changes consumption little. A tax on an elastic good changes behaviour a lot but raises less. Which outcome a government wants depends on whether the aim is revenue or behaviour change — and tobacco duty is asked to do both.
- Who bears the tax. The more inelastic demand is relative to supply, the more of an indirect tax is passed on to consumers.
- Subsidies. The same logic in reverse: a subsidy on an elastic good produces a larger change in quantity.
Key terms
| Term | Meaning |
|---|---|
| Price elasticity of demand | Responsiveness of quantity demanded to a change in price |
| Income elasticity of demand | Responsiveness of quantity demanded to a change in real income |
| Cross elasticity of demand | Responsiveness of demand for one good to a change in the price of another |
| Normal good | Demand rises as income rises (positive YED) |
| Inferior good | Demand falls as income rises (negative YED) |
| Substitutes | Goods bought instead of each other (positive XED) |
| Complements | Goods bought alongside each other (negative XED) |
| Total revenue | Price multiplied by quantity sold |
Common mistakes
- Dividing by the new value instead of the original. The denominator is always the starting figure.
- Dropping the minus sign on PED. It is negative, and the sign is the point for YED and XED.
- Confusing elastic with "large". Elasticity is about proportional response, not size of change.
- Saying a price rise always raises revenue. It only does so if demand is inelastic.
- Treating elasticity as fixed. It varies along a straight-line demand curve, and changes with time and market definition.
- Mixing up income elasticity and the income effect. YED is about how demand shifts when income changes; the income effect is about real purchasing power when a price changes.
How this has been examined
In the Edexcel papers indexed on this site, this topic has appeared in seven formats:
- 1-mark multiple choice — asked 7 times across 5 series (2017 to 2025)
- 8-mark "Examine" data response — asked 4 times across 4 series (2018 to 2023)
- 2-mark calculation — asked 4 times across 2 series (2017 to 2022)
- 12-mark "Discuss" data response — asked once (2025)
- 5-mark "Explain" data response — asked once (2024)
- 4-mark "Explain" data response — asked once (2024)
- 2-mark "Explain" — asked once (2018)
It has appeared at every tariff from 1 to 12 marks.
Where this goes next
Elasticity is applied almost immediately: 1.2.9 Indirect taxes and subsidies depends on it to work out who bears a tax, and 1.2.5 Elasticity of supply applies the same logic to producers. The revenue relationship returns in Theme 3 at 3.3.1 Revenue, and elasticity underpins the analysis of 1.4.1 Government intervention in markets.
Otti is an AI tutor built for A-Level students. Ask it anything, practise exam questions, and get instant feedback written like an examiner would give it — not just right or wrong, but why.
Get one answer marked free