Edexcel A-Level Economics · Revision notes
2.5.2 Output gaps
An economy's actual output rarely matches what it could produce sustainably. Sometimes it produces less, leaving workers and machinery idle. Sometimes it produces more than it can keep up for long. This topic covers the difference between actual growth and trend growth, positive and negative output gaps, why output gaps are hard to measure, and how to show them on an AD/AS diagram.
Actual growth and trend growth
The actual growth rate is the percentage change in real GDP from one period to the next. It moves around a great deal: strong in some years, weak or negative in others.
The trend growth rate is the average rate at which the economy's productive capacity grows over the long term. It reflects the steady growth in the labour force, capital, technology and productivity, so it changes only slowly.
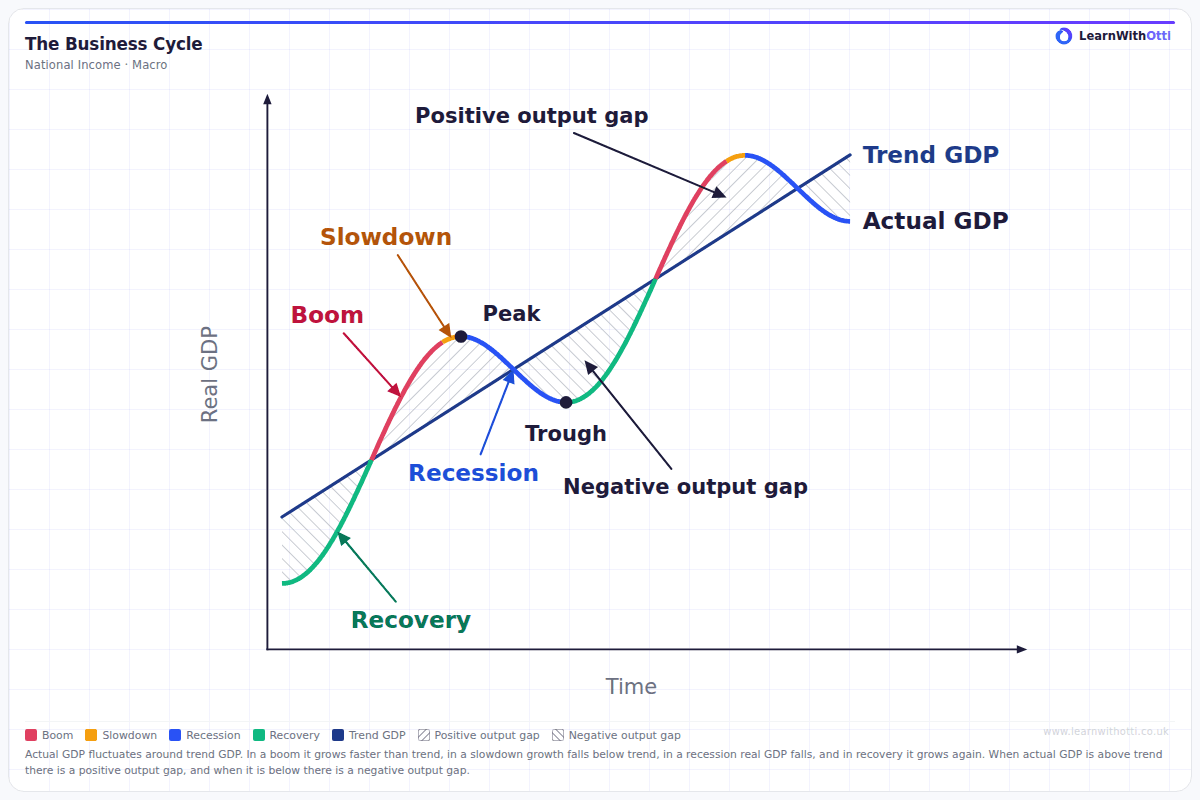
On the diagram, the navy line shows trend GDP, the economy's potential output growing over time. The coloured line shows actual GDP, rising above and falling below the trend. The hatched areas are the output gaps: positive where actual GDP is above trend, negative where it is below. In the UK, trend growth was usually put at around 2.5% a year in the decades before the 2008 financial crisis, and estimates since then have been noticeably lower, reflecting weak growth in productivity.
Key distinction: When actual growth is faster than trend growth, the economy is using up its spare capacity. When actual growth is slower than trend growth, spare capacity is building up, even if the economy is still growing.
Output gaps
An output gap is the difference between actual output and potential output. It is usually expressed as a percentage of potential output.
Negative output gap
A negative output gap exists when actual output is below potential output. The economy has spare capacity.
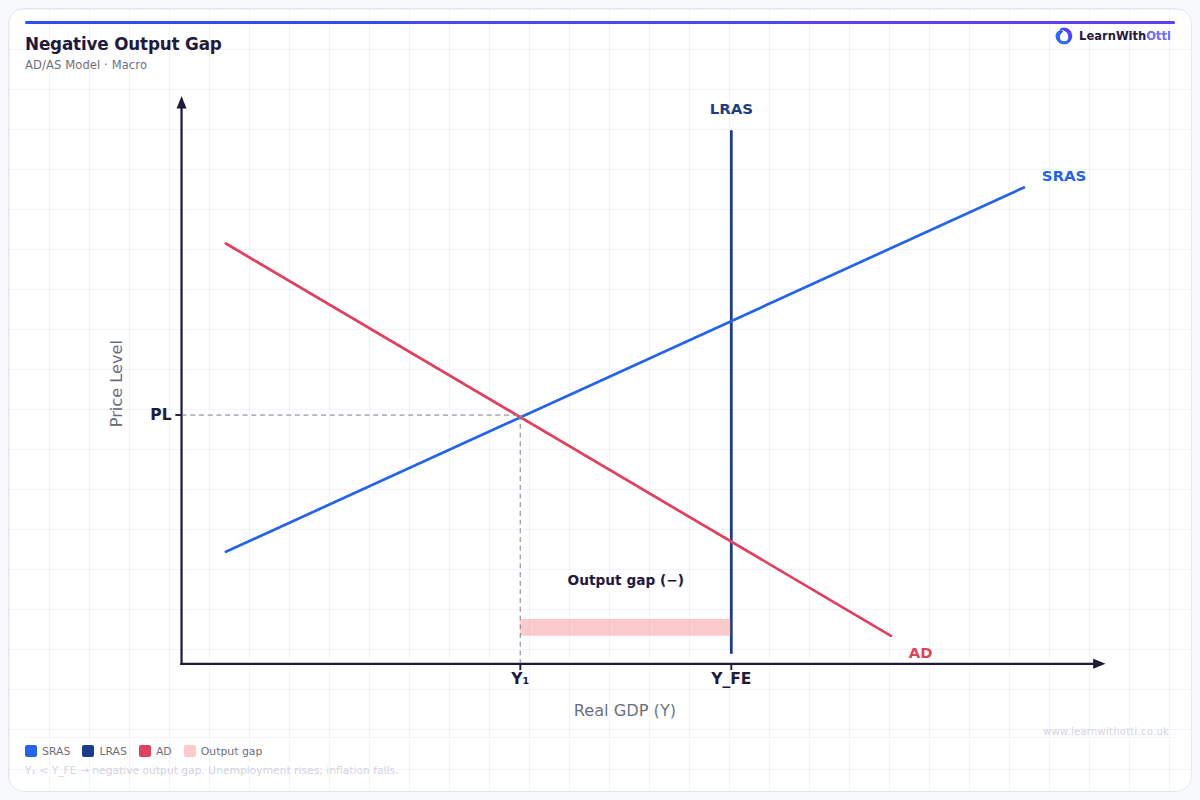
- Unemployment is above its normal level, because firms need fewer workers.
- Factories and offices are under-used, so firms have little reason to invest in more capacity.
- Inflationary pressure is weak. With spare workers and capacity, firms find it hard to raise prices and workers find it hard to win pay rises.
A large negative output gap is typical of a recession.
Positive output gap
A positive output gap exists when actual output is above potential output. The economy is producing more than it can sustain.
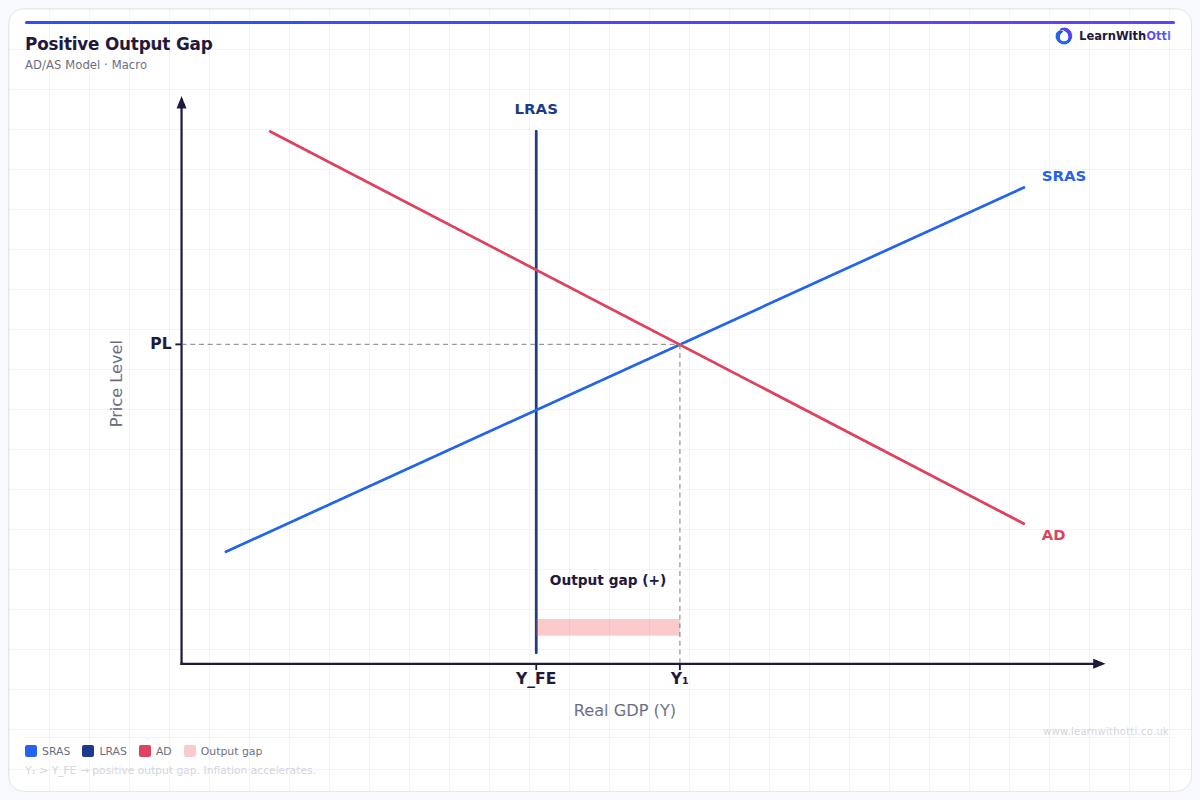
Watch out: This can seem impossible, but potential output is the level the economy can sustain without rising inflation, not an absolute physical maximum.
For a while, firms can produce more by:
- paying workers overtime and recruiting people who would not normally be in work
- running machinery for longer and delaying maintenance
- drawing down stocks of finished goods
The result is shortages of labour and materials, rising wages and costs, and inflationary pressure. A positive output gap cannot last, because workers tire and machinery wears out. It is typical of a boom.
Showing an output gap on an AD/AS diagram
An AD/AS diagram shows the output gap as the horizontal distance between equilibrium real output and the full-capacity level of output.
- Classical diagram. LRAS is vertical at the full-capacity level of output (Yfe). If AD and short-run aggregate supply (SRAS) intersect to the left of LRAS, real output is below Yfe and there is a negative output gap equal to the distance from equilibrium output to Yfe. If they intersect to the right of LRAS, there is a positive output gap.
- Keynesian diagram. If AD cuts the AS curve on its horizontal or upward-sloping section, the economy is operating below full capacity. The distance from equilibrium output to the vertical section of the curve shows the level of spare capacity.
Label both axes (price level and real output), the equilibrium output and the full-capacity level of output, and mark the gap between them clearly.
The difficulties of measuring output gaps
Actual output can be measured, if imperfectly. Potential output cannot be observed at all, so it has to be estimated. This creates several problems.
- Potential output is an estimate. It is calculated using statistical techniques and business surveys about spare capacity and recruitment difficulties. Different methods give different answers.
- GDP figures are revised. Early estimates of real GDP are often revised months or years later, so the measured gap changes after the event.
- Trend growth changes. After the 2008 financial crisis, productivity growth in the UK slowed sharply. Estimates made at the time assumed the old trend would return, so the negative output gap was thought to be larger than it later turned out to be.
- Structural change. Shocks such as the coronavirus pandemic, changes in migration or new technology change the economy's capacity in ways that are hard to measure quickly.
- Different organisations disagree. The Office for Budget Responsibility, the Bank of England and international bodies publish their own estimates, which can differ in size and even in sign.
Evaluation: These difficulties matter for policy. If policymakers believe there is a negative output gap when there is not, they may stimulate demand and cause inflation. If they underestimate spare capacity, they may hold the economy back unnecessarily.
Key terms
| Term | Meaning |
|---|---|
| Actual growth rate | The percentage change in real GDP from one period to the next |
| Trend growth rate | The average long-term rate of growth of productive capacity |
| Potential output | The level of output the economy can sustain without rising inflation |
| Output gap | The difference between actual and potential output, as a percentage of potential output |
| Negative output gap | Actual output below potential output, so there is spare capacity |
| Positive output gap | Actual output above potential output, so the economy is overheating |
| Spare capacity | Unused factors of production that could be brought into use |
Common mistakes
- Confusing slower growth with a negative output gap. An economy can be growing and still have a widening negative output gap, if actual growth is below trend growth.
- Saying a positive output gap means output is above the absolute maximum. Potential output is the sustainable level, not the most that could ever be produced.
- Measuring the gap vertically on an AD/AS diagram. The output gap is a gap in real output, so it is a horizontal distance.
- Treating output gap figures as precise. They are estimates, and they are often revised.
How this has been examined
In the Edexcel papers indexed on this site, this topic has appeared in two formats:
- 5-mark "Explain" data response — asked once (2017)
- 1-mark multiple choice — asked once (2024)
Where this goes next
Output gaps rise and fall over the course of the 2.5.3 Trade (business) cycle. The link to inflation and unemployment is covered in 2.1.2 Inflation and 2.1.3 Employment and unemployment. The diagrams build on 2.3.3 Long-run AS and 2.4.3 Equilibrium levels of real national output, and policies to close an output gap are covered in 2.6.2 Demand-side policies.
Otti is an AI tutor built for A-Level students. Ask it anything, practise exam questions, and get instant feedback written like an examiner would give it — not just right or wrong, but why.
Get one answer marked free