Edexcel A-Level Economics · Revision notes
4.2.2 Inequality
Inequality is about how unevenly income and wealth are shared out, both within a country and between countries. Some inequality is an unavoidable feature of a market economy, and some economists argue it is necessary for incentives. But high inequality can harm growth, health and social stability. This topic covers how inequality is defined and measured, what causes it, and how it changes as economies develop.
Wealth inequality and income inequality
- Income is a flow of money received over a period of time: wages, salaries, rent, interest, dividends, profit and state benefits.
- Wealth is a stock of assets owned at a point in time: property, shares, savings, pension funds and possessions.
Key distinction: The two are linked, because wealth generates income (rent, interest and dividends), and income that is saved builds up wealth. But wealth is much more unequally distributed than income in the UK, and in most countries.
Wealth can also be passed down through inheritance, so wealth inequality tends to persist across generations.
Measuring income inequality: the Lorenz curve
A Lorenz curve shows the share of total income received by each cumulative percentage of the population, ranked from poorest to richest.
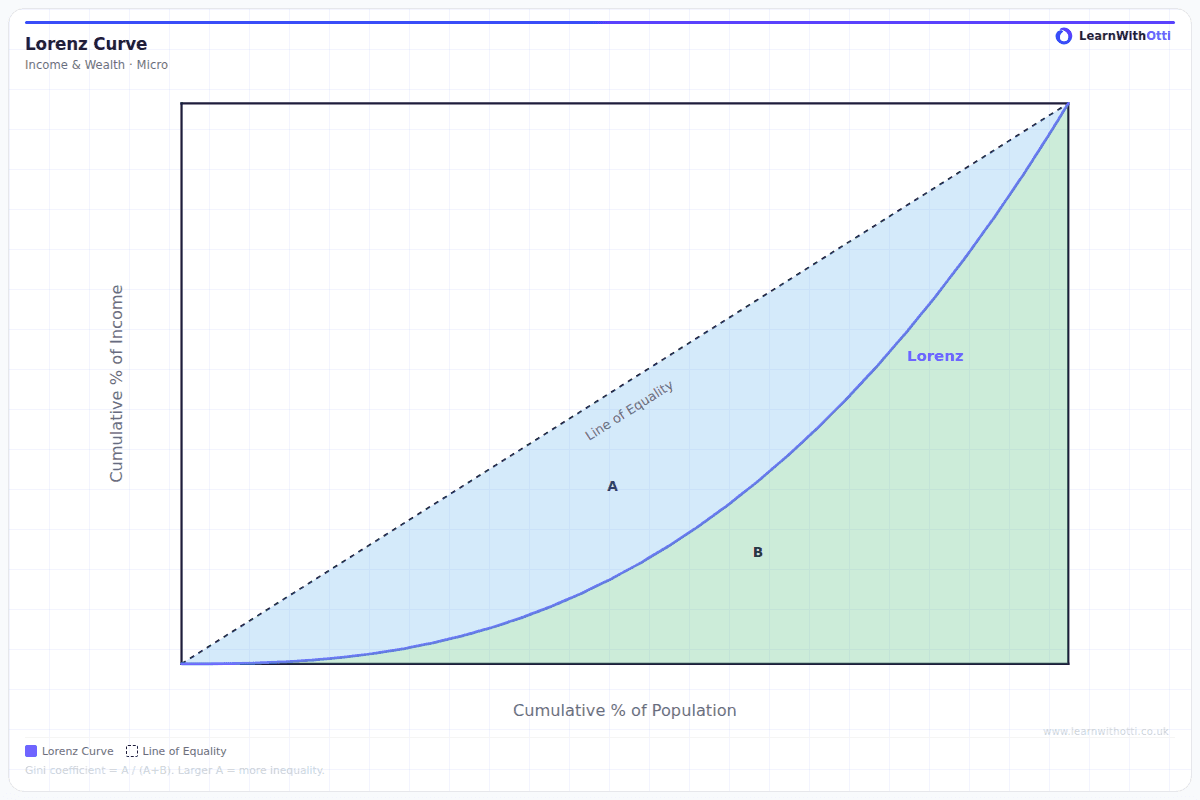
- The horizontal axis shows the cumulative percentage of households, from 0% to 100%.
- The vertical axis shows the cumulative percentage of income, from 0% to 100%.
- A straight 45-degree line of perfect equality shows what would happen if income were shared equally: the poorest 20% would receive 20% of income, the poorest 50% would receive 50%, and so on.
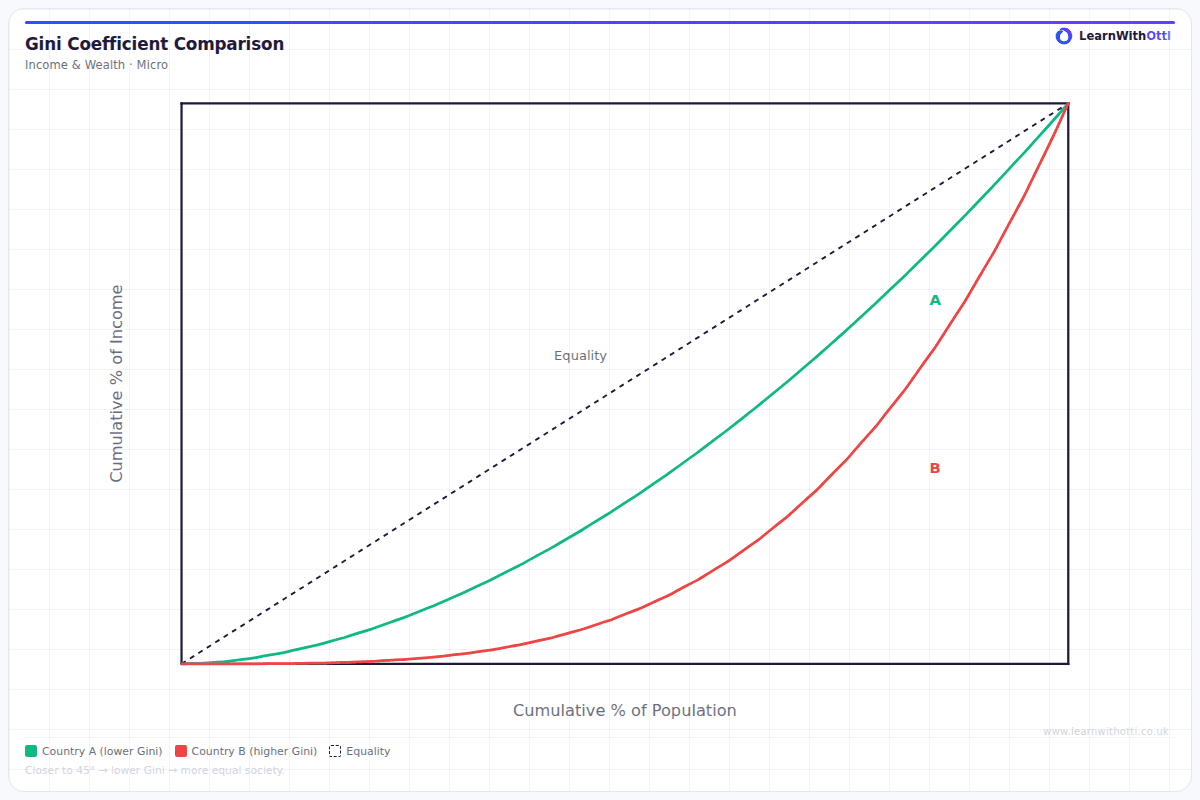
- The Lorenz curve sags below this line. The further it bows away from the line of equality, the more unequal the distribution.
If two countries' Lorenz curves are drawn on the same diagram, the one closer to the line of equality has the more equal distribution of income.
The Gini coefficient
The Gini coefficient turns the Lorenz curve into a single number. Call the area between the line of equality and the Lorenz curve A, and the area below the Lorenz curve B:
Gini coefficient = A ÷ (A + B)
- A value of 0 means perfect equality: the Lorenz curve lies on the line of equality.
- A value of 1 means perfect inequality: one household receives all the income.
It is sometimes expressed as a percentage, from 0 to 100.
A worked example. The whole triangle under the line of equality has an area of 0.5 (on axes running from 0 to 1). If the area between the line and the Lorenz curve is 0.15, the Gini coefficient is 0.15 ÷ 0.5 = 0.3.
Evaluation: The Gini coefficient is useful for comparing countries and tracking change over time. But different Lorenz curves can give the same Gini coefficient, so it does not show where in the distribution the inequality lies.
Causes of inequality within countries
- Differences in skills and education. Workers with scarce, high-level skills earn much more than those without.
- Differences in wealth and inheritance. Those who own assets receive income from them, and inherited wealth passes advantage between generations.
- Unemployment and economic inactivity. Households without earned income rely on benefits, which are usually lower than wages.
- The tax and benefit system. Progressive taxes and benefits reduce inequality; regressive taxes increase it.
- Bargaining power. Strong trade unions and minimum wages can compress pay differences; their decline can widen them.
- Discrimination by gender, ethnicity or disability, which lowers some groups' earnings.
- Technological change and globalisation, which have raised demand for high-skilled workers and reduced demand for some lower-skilled jobs in developed economies.
Causes of inequality between countries
- Differences in productivity, linked to education, capital and technology.
- Natural resources, though resource wealth does not always lead to broad prosperity.
- The quality of institutions, such as the rule of law, property rights and stable government.
- Access to trade and investment, which allows some countries to grow much faster than others.
- Historical factors, including colonialism, and current problems such as conflict and debt.
The impact of economic change and development on inequality
Economic growth does not affect everyone equally. In the early stages of development, growth often increases inequality, as some people move into higher-paid jobs in industry and cities while others remain in low-income farming. As development continues, more people share in the gains through education, wider employment and the welfare state, and inequality may fall. This pattern is described by the Kuznets curve, though many countries do not follow it.
Structural change in developed economies, such as the decline of manufacturing and the growth of high-skilled services, has tended to widen income gaps.
The significance of capitalism for inequality
In a capitalist economy, incomes are largely set by markets, and private owners keep the returns on their capital.
- The case that inequality is a necessary part of capitalism: differences in rewards create incentives to work, train, take risks and start businesses. Without them, effort and enterprise would fall, and everyone might be worse off.
- The case that capitalism tends to increase inequality: those who own capital receive a return on it, which can be reinvested, so wealth concentrates over time. The economist Thomas Piketty argued that when the return on capital exceeds the rate of economic growth, wealth becomes more concentrated in the hands of those who already own it.
Most economies are mixed: markets generate inequality, and governments reduce some of it through taxes, benefits and public services.
Key terms
| Term | Meaning |
|---|---|
| Income | A flow of money received over a period of time |
| Wealth | A stock of assets owned at a point in time |
| Lorenz curve | A curve showing the cumulative share of income received by each cumulative share of the population |
| Line of perfect equality | The 45-degree line on a Lorenz diagram showing an equal distribution |
| Gini coefficient | A measure of inequality from 0 (perfect equality) to 1 (perfect inequality) |
| Kuznets curve | The idea that inequality first rises and then falls as an economy develops |
Common mistakes
- Confusing income and wealth. Income is a flow; wealth is a stock.
- Reading the Lorenz curve the wrong way. The further the curve is from the line of equality, the greater the inequality.
- Getting the Gini formula upside down. It is the area between the line and the curve divided by the whole area under the line.
- Equating inequality with poverty. A country can have low poverty and high inequality, or the reverse.
- Arguing only one side on capitalism. Inequality can create incentives and also entrench advantage.
How this has been examined
In the Edexcel papers indexed on this site, this topic has appeared in seven formats:
- 25-mark "Evaluate" essay — asked once (2020)
- 10-mark "Assess" data response — asked once (2018)
- 8-mark "Examine" data response — asked twice across 2 series (2019 to 2022)
- 5-mark "Explain" data response — asked once (2022)
- 4-mark "Explain" data response — asked once (2017)
- 2-mark "Explain" data response — asked once (2019)
- 1-mark multiple choice — asked once (2017)
It has appeared at every tariff from 1 to 25 marks.
Where this goes next
Inequality is closely linked to 4.2.1 Absolute and relative poverty. Its relationship with development is explored in 4.3.1 Measures of development and 4.3.2 Factors influencing growth and development. Government action to redistribute income through progressive taxation and spending is covered in 4.5.2 Taxation and 4.5.1 Public expenditure.
End of topic 4.2
Quiz yourself on 4.2 Poverty and inequality
10 multiple-choice questions drawn from the 54 we have on the whole of topic 4.2, with instant feedback on every answer.
Start the 4.2 quiz →Otti is an AI tutor built for A-Level students. Ask it anything, practise exam questions, and get instant feedback written like an examiner would give it — not just right or wrong, but why.
Get one answer marked free