Edexcel A-Level Economics · Revision notes
3.4.3 Monopolistic competition
Monopolistic competition describes markets with many small firms, each selling a product that is slightly different from its rivals'. Hairdressers, restaurants, cafés and independent clothing shops are typical examples. As the name suggests, it combines features of monopoly and of perfect competition, and it is much closer to many real markets than either.
Characteristics of monopolistically competitive markets
- Many firms, each with a small share of the market. No single firm is large enough to influence the market as a whole, so each one makes its own pricing decisions without worrying much about how rivals will react. This is the key difference from oligopoly.
- Differentiated products. Each firm's product is slightly different, through location, quality, style, branding or service. A café near a train station is not quite the same product as one across town. Because customers see the products as close but not perfect substitutes, some will stay loyal even if a rival is slightly cheaper.
- Low barriers to entry and exit. New firms can set up relatively easily, because start-up costs are low and there are few economies of scale or legal restrictions. Existing firms can leave without losing much. This is what stops supernormal profit lasting in the long run.
- Some price-making power. Because its product is distinctive, each firm faces a downward-sloping demand curve. It can raise its price a little without losing every customer, but a large rise would send many customers to close substitutes.
- Firms aim to maximise profit. Each firm produces where marginal cost equals marginal revenue (MC = MR).
The monopoly element is the differentiated product, which gives each firm a small amount of market power. The competitive element is the large number of firms and the ease of entry, which limit that power.
It can look like a local monopoly. Market share depends on how the market is defined. An independent café has a tiny share of the national market for coffee, well below 0.001%. But in a small village or town it may be the only café, with 100% of the local market. Within its own area it can behave a little like a monopolist, setting its own price without close rivals nearby. Its power is still limited, because customers can travel a short distance to another café or make coffee at home, and because low barriers to entry mean a new café could open nearby if it starts making supernormal profit.
The firm's demand curve
Each firm's demand curve slopes downwards, but it is relatively price elastic. There are many close substitutes, so a firm that raises its price significantly loses many customers to rivals. The more successfully a firm differentiates its product, through branding or quality, the less elastic its demand becomes.
Because the demand curve slopes downwards, marginal revenue (MR) lies below average revenue (AR).
Short-run equilibrium
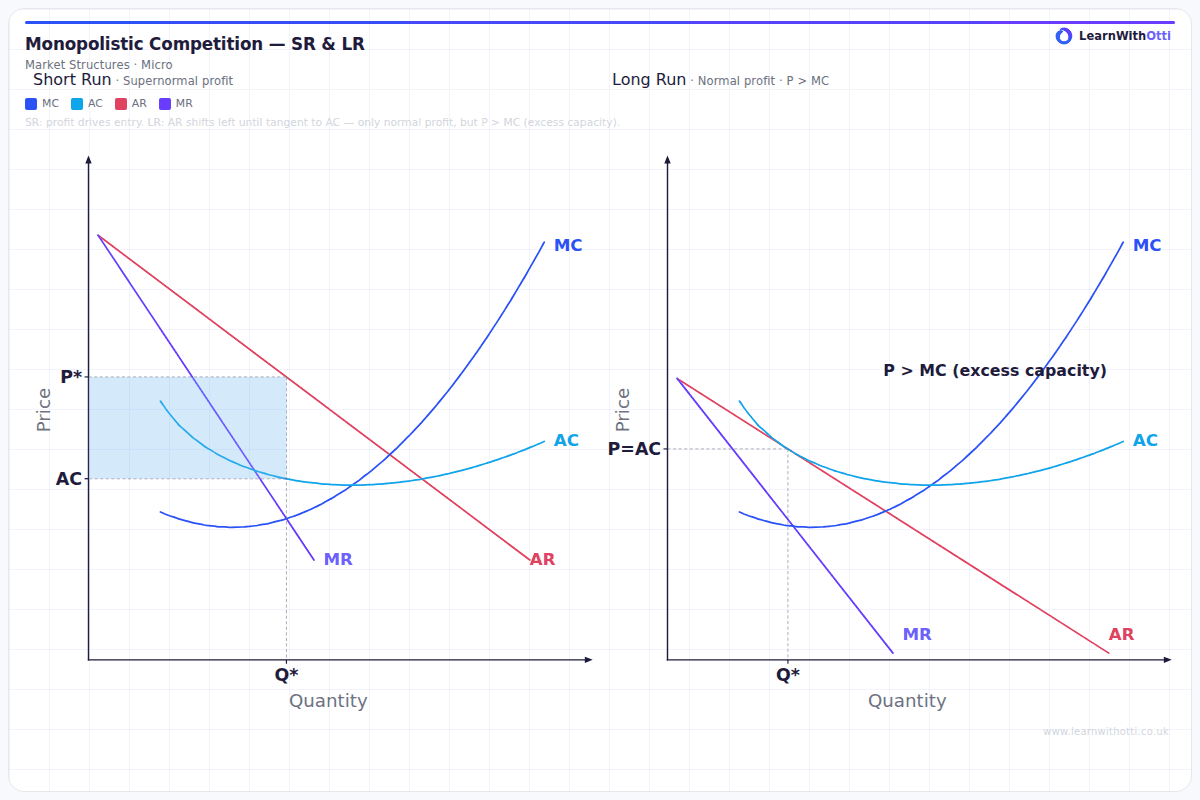
The firm maximises profit where MC = MR, and sets the price on its demand (AR) curve above that output.
In the short run, the firm can make supernormal profit if price is above average cost (AC) at that output. A firm with a popular new product, or a good location with few rivals nearby, may do so. A firm can also make a loss in the short run if demand for its product is weak.
Long-run equilibrium
Low barriers to entry mean supernormal profit attracts new firms.
- New firms enter, offering close substitutes.
- Each existing firm loses some customers, so its demand curve shifts to the left.
- Its demand also becomes more elastic, because there are now more substitutes.
- Entry continues until supernormal profit is competed away.
In long-run equilibrium, the firm makes normal profit. On the diagram, the AR curve just touches the AC curve at the profit-maximising output, where MC = MR. This is a tangency point, and it lies on the downward-sloping part of the AC curve, to the left of its minimum.
If firms are making losses, some leave the market, and the remaining firms' demand curves shift right until they make normal profit.
Diagrammatic analysis
The diagram for one firm shows:
- a downward-sloping AR curve, with MR below it;
- MC and AC curves, with MC cutting AC at its minimum;
- the profit-maximising output where MC = MR, and price read off the AR curve above it.
In the short-run diagram, AR lies above AC at that output, and the rectangle between them is supernormal profit. In the long-run diagram, AR is tangent to AC at that output, so price equals AC and there is no supernormal profit.
Efficiency in monopolistic competition
In long-run equilibrium:
- Not allocatively efficient. Price is above marginal cost, because the demand curve slopes downwards.
- Not productively efficient. Output is below the level at which AC is lowest. Each firm has excess capacity: it could produce more at a lower average cost but does not, because it would have to cut its price.
- Some dynamic efficiency. Competition encourages firms to keep differentiating their products, but with only normal profit in the long run, there is little money for major research.
Against this, consumers benefit from variety and choice. The excess capacity can be seen as the cost of having many different products rather than one standard one.
Watch out: Real markets often mix market structures, and coffee is a good example. Nationally, the market for coffee shops is an oligopoly, dominated by large chains such as Costa and Starbucks. Locally, small independent cafés compete alongside them in a way that looks much more like monopolistic competition. When you analyse a market, say which level you are looking at, national or local, because the answer can change the market structure you identify.
Key terms
| Term | Meaning |
|---|---|
| Monopolistic competition | A market with many firms selling differentiated products and low barriers to entry |
| Product differentiation | Making a product distinct from rivals' through quality, branding, location or service |
| Excess capacity | When a firm produces below the output at which average cost is lowest |
| Tangency equilibrium | The long-run position where the AR curve just touches the AC curve, giving normal profit |
Common mistakes
- Drawing a horizontal demand curve. The firm's demand curve slopes downwards because its product is differentiated.
- Placing long-run equilibrium at the minimum of AC. The tangency is on the falling part of AC, to the left of its minimum.
- Leaving supernormal profit in the long run. Low barriers to entry compete it away.
- Confusing monopolistic competition with monopoly. There are many firms, and each has only a small amount of market power.
- Ignoring the benefit of variety. The inefficiency comes with greater consumer choice.
How this has been examined
In the Edexcel papers indexed on this site, this topic has appeared in three formats:
- 5-mark "Explain" data response — asked once (2021)
- 4-mark "Draw" diagram — asked twice across 2 series (2019 to 2023)
- 1-mark multiple choice — asked twice across 2 series (2019 to 2025)
Where this goes next
The revenue curves of a firm facing downward-sloping demand are in 3.3.1 Revenue, and normal and supernormal profit in 3.3.4 Normal profits, supernormal profits and losses. The efficiency criteria used here are set out in 3.4.1 Efficiency. The model sits between 3.4.2 Perfect competition and 3.4.4 Oligopoly, and the role of barriers to entry is developed in 3.4.7 Contestability.
Otti is an AI tutor built for A-Level students. Ask it anything, practise exam questions, and get instant feedback written like an examiner would give it — not just right or wrong, but why.
Get one answer marked free