Edexcel A-Level Economics · Revision notes
2.6.2 Demand-side policies
Demand-side policies aim to influence the level of aggregate demand (AD) in the economy. By raising AD, the authorities can boost output and employment in a recession. By reducing AD, they can bring down inflation when the economy is overheating. There are two types: monetary policy, run in the UK by the Bank of England, and fiscal policy, run by the government. This topic covers how each works, how they are shown on AD/AS diagrams, how they were used in the Great Depression and the Global Financial Crisis of 2008, and their strengths and weaknesses.
Monetary and fiscal policy
- Monetary policy is the use of interest rates, the money supply and the availability of credit to influence AD. In the UK it is set by the Monetary Policy Committee (MPC) of the Bank of England.
- Fiscal policy is the use of government spending and taxation to influence AD. In the UK it is set by the Chancellor of the Exchequer, mainly through the annual Budget.
Both can be expansionary (raising AD) or contractionary (reducing AD).
Key distinction: The key difference is who controls them and the channel they work through. Monetary policy works mainly through borrowing, saving and asset prices. Fiscal policy works directly through government spending, which is a component of AD, and through the effect of taxes on disposable income and profits.
Monetary policy: interest rates
The Bank of England sets Bank Rate, the interest rate it pays on the reserves commercial banks hold with it. Changes in Bank Rate feed through to the interest rates banks charge on loans and mortgages and pay on savings.
How a cut in interest rates raises AD
- Consumption rises. Saving becomes less attractive and borrowing becomes cheaper, so households spend more. Households with variable rate mortgages have lower repayments and more disposable income.
- Investment rises. Borrowing to fund new capital is cheaper, so more projects become profitable.
- Asset prices rise. Lower rates tend to raise house and share prices. Households feel wealthier and spend more, which is the wealth effect.
- The exchange rate tends to fall. Lower UK interest rates make it less attractive to hold savings in sterling, so demand for the pound falls. A weaker pound makes UK exports cheaper for foreign consumers and imports dearer, so net trade improves.
A rise in interest rates works in reverse, reducing consumption, investment and net trade, and so reducing AD and inflation.
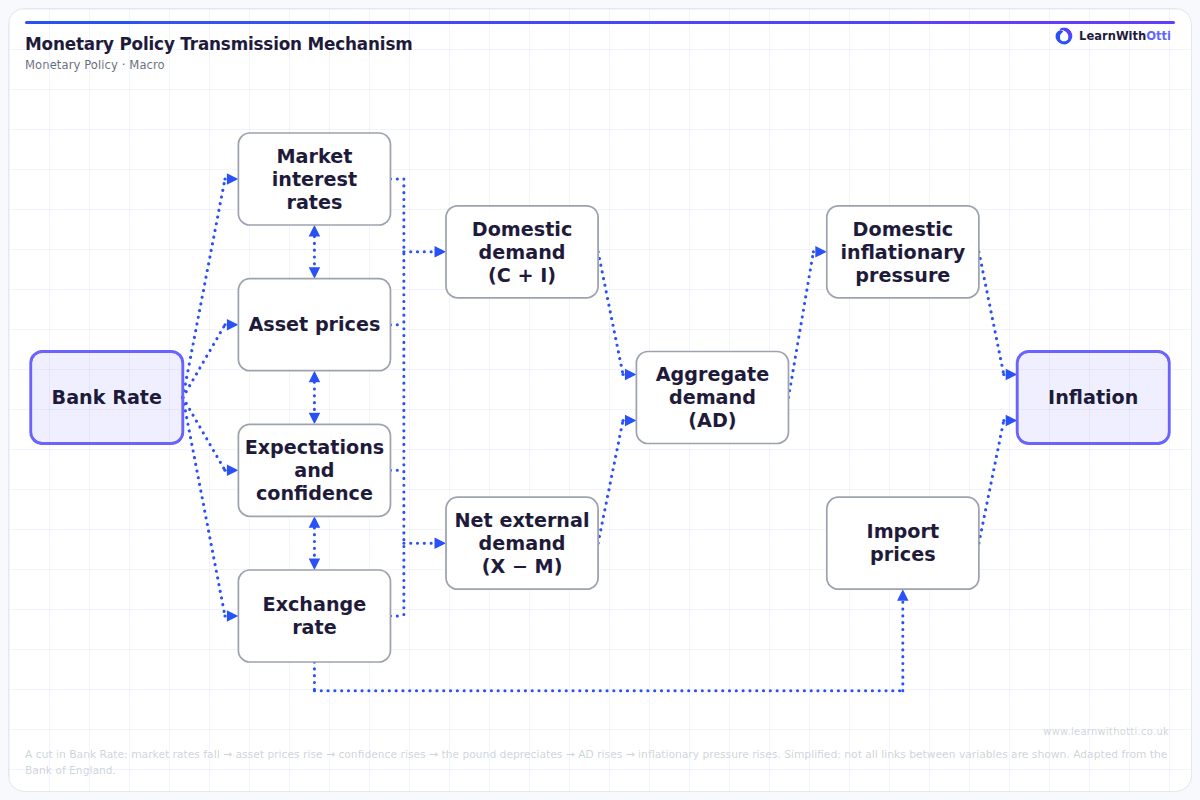
These links are called the transmission mechanism. The effects take time. The Bank of England has said that it can take up to around two years for a change in interest rates to have its full effect on inflation.
Monetary policy: quantitative easing
When interest rates are already close to zero, cutting them further has little effect. The Bank of England then used quantitative easing (QE): creating new money electronically to buy assets, mainly government bonds, from financial institutions such as pension funds and insurance companies.
How QE raises AD
- The Bank of England buys large quantities of bonds, which increases the money supply.
- Extra demand for bonds raises their price and lowers their yield, so long-term interest rates fall. This makes borrowing cheaper for households and firms.
- The financial institutions that sold the bonds now hold money. They use it to buy other assets, such as shares and corporate bonds, which raises their prices and creates a wealth effect.
- Banks have more reserves, which may make them more willing to lend.
- Lower returns on UK assets tend to weaken the pound, which helps exports.
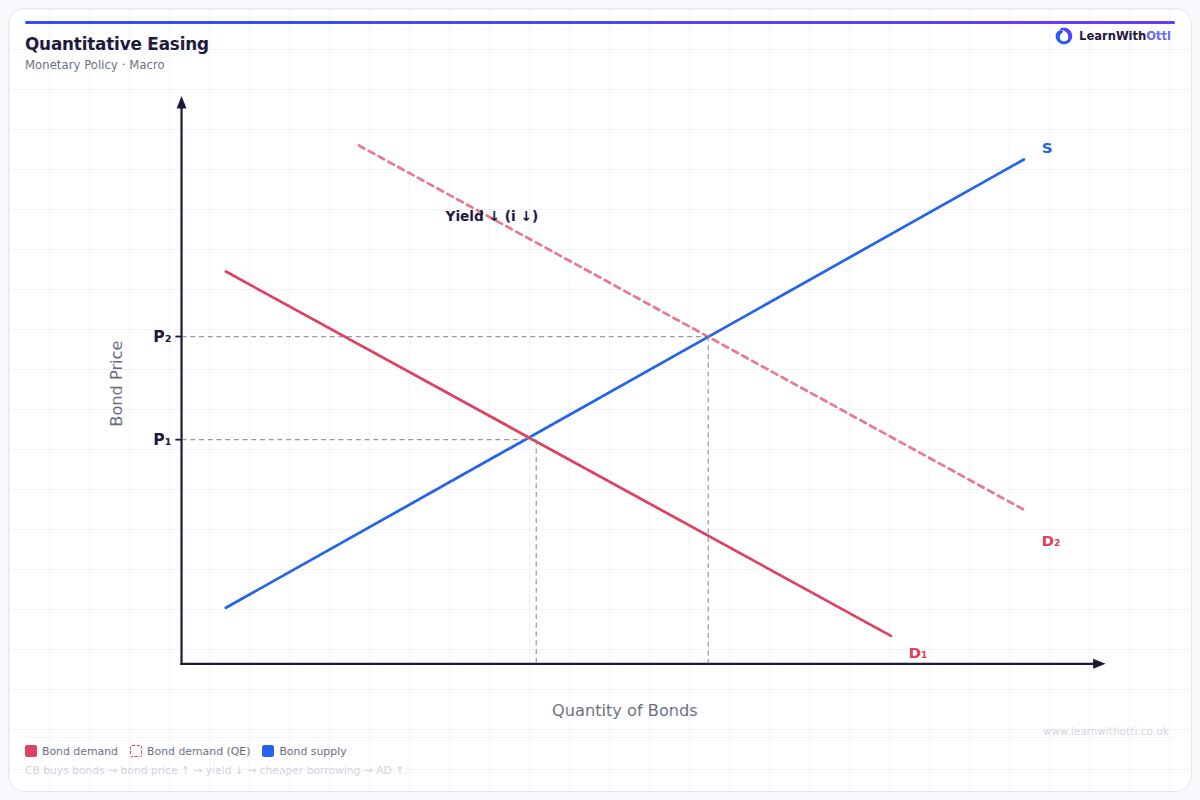
The Bank of England first used QE in March 2009, and used it again after the 2016 EU referendum and during the Covid-19 pandemic. In total it bought £895 billion of assets. Since 2022 it has been reducing its holdings, a process known as quantitative tightening.
Concerns about QE
- Its effect on spending is uncertain, because banks may hold the extra reserves rather than lend.
- It raises the prices of assets such as shares and houses, which are mainly owned by wealthier households, so it may widen inequality.
- If too much money is created, it may cause inflation in the long run.
The role of the Bank of England and the MPC
The Bank of England is the UK's central bank. It has been operationally independent since 1997: the government sets the inflation target, but the Bank decides how to hit it, free from political pressure.
The Monetary Policy Committee
- Remit. The Chancellor sets the target each year, currently 2% CPI inflation. Subject to that, the MPC should also support the government's objectives for growth and employment.
- Membership. Nine members: the Governor, three Deputy Governors, the Chief Economist and four external members appointed by the Chancellor.
- Meetings. The MPC meets eight times a year to set Bank Rate and decide on asset purchases or sales. Each member has one vote and the decision is by majority. The minutes and the votes of each member are published.
- Accountability. If inflation is more than 1 percentage point above or below the target, the Governor must write an open letter to the Chancellor explaining why and what the MPC will do about it.
How the MPC decides. Interest rates affect inflation with a long time lag, so the MPC looks at forecasts of inflation around two years ahead rather than today's rate. It considers evidence on GDP growth, wage growth, unemployment, house prices, the exchange rate, commodity prices and inflation expectations.
Fiscal policy: government spending and taxation
Expansionary fiscal policy means raising government spending, cutting taxes, or both.
- Higher government spending, for example on infrastructure, schools or hospitals, adds directly to AD, because government spending is a component of AD.
- Lower income tax raises households' disposable income, so consumption rises.
- Lower corporation tax raises firms' post-tax profits, so they have more funds and more incentive to invest.
The initial rise in AD is magnified by the multiplier: extra spending becomes someone else's income, part of which is spent again. This is covered in 2.4.4 The multiplier.
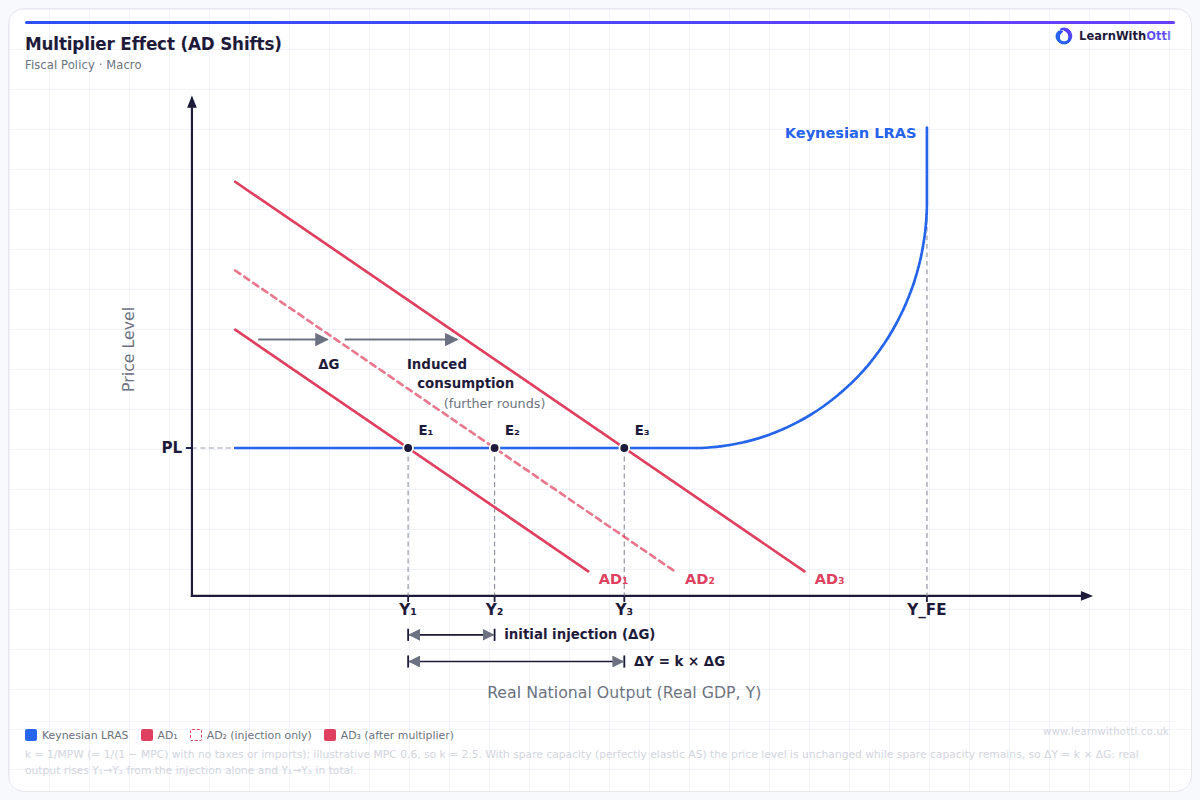
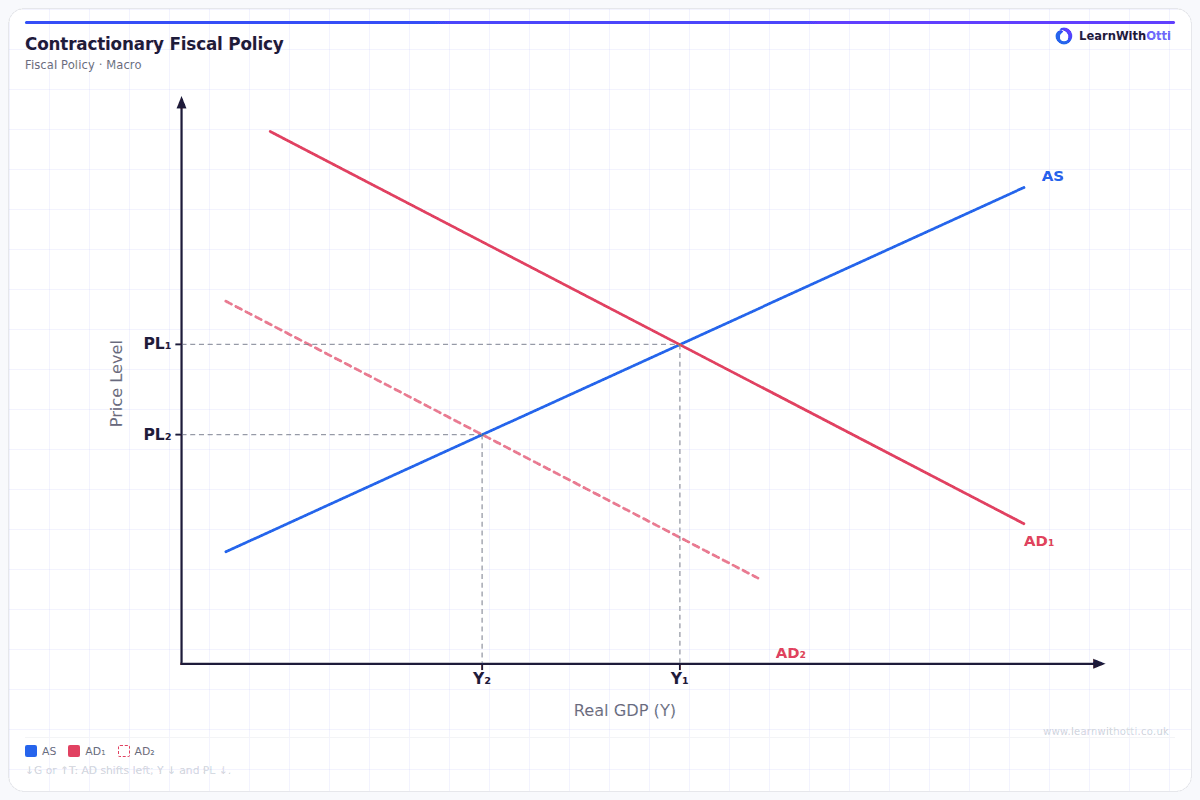
Contractionary fiscal policy means cutting government spending, raising taxes, or both. It reduces AD and so reduces inflationary pressure, but at the cost of lower output and higher unemployment in the short run.
Discretionary policy and automatic stabilisers
- Discretionary fiscal policy is a deliberate decision to change spending or tax rates, such as a temporary cut in VAT.
- Automatic stabilisers change without any decision being made. In a recession, tax revenue falls as incomes and spending fall, and spending on benefits such as Universal Credit rises as unemployment rises. Both cushion the fall in AD. In a boom they work in reverse.
Budget deficits and surpluses
- A budget (fiscal) deficit occurs when government spending is greater than government revenue in a year. The government must borrow to cover the gap.
- A budget (fiscal) surplus occurs when government revenue is greater than government spending in a year. The government can use it to repay debt.
Key distinction: The deficit is a flow: the amount borrowed in one year. The national debt is a stock: the total amount owed, built up from past deficits. A government can cut its deficit and still see its debt rise, as long as it is still borrowing.
Expansionary fiscal policy usually increases the deficit, and contractionary policy usually reduces it. The UK has run a budget deficit in most years since the early 2000s.
Direct and indirect taxation
Direct taxes are taxes on income and wealth. They are paid directly to HM Revenue and Customs by the person or firm that is taxed.
- Income tax
- National Insurance contributions
- Corporation tax, a tax on company profits
- Capital gains tax and inheritance tax
Indirect taxes are taxes on spending. They are collected by the seller and passed to the government, so part of the tax can be passed on to consumers through higher prices. How much is passed on depends on the price elasticity of demand.
- Value added tax (VAT), charged at a standard rate of 20%
- Excise duties on fuel, alcohol and tobacco
- The Soft Drinks Industry Levy
Direct taxes such as income tax are usually progressive, taking a larger percentage of income from people on higher incomes. Indirect taxes tend to be regressive, taking a larger share of income from low-income households, because they spend a larger share of what they earn.
Illustrating demand-side policies on AD/AS diagrams
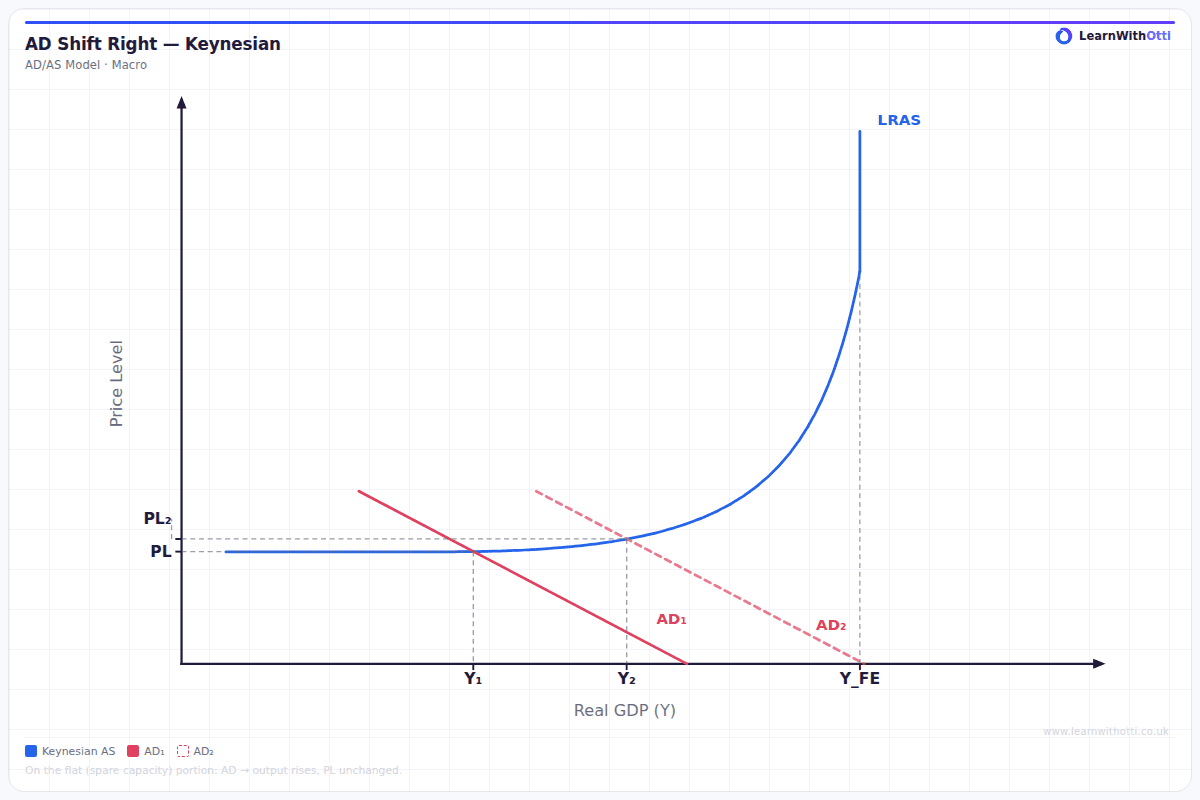
Expansionary monetary or fiscal policy shifts AD to the right, and contractionary policy shifts it to the left. What happens to output and prices depends on how much spare capacity the economy has.
With spare capacity. On the Keynesian AS curve, if the economy is in the horizontal or lower part of the curve, a rightward shift in AD raises real output and employment with little or no rise in the price level.
Close to or at full capacity. If the economy is near full capacity, the same shift in AD mainly raises the price level. On the classical view, where LRAS is vertical, extra demand has no effect on real output in the long run and only causes inflation.
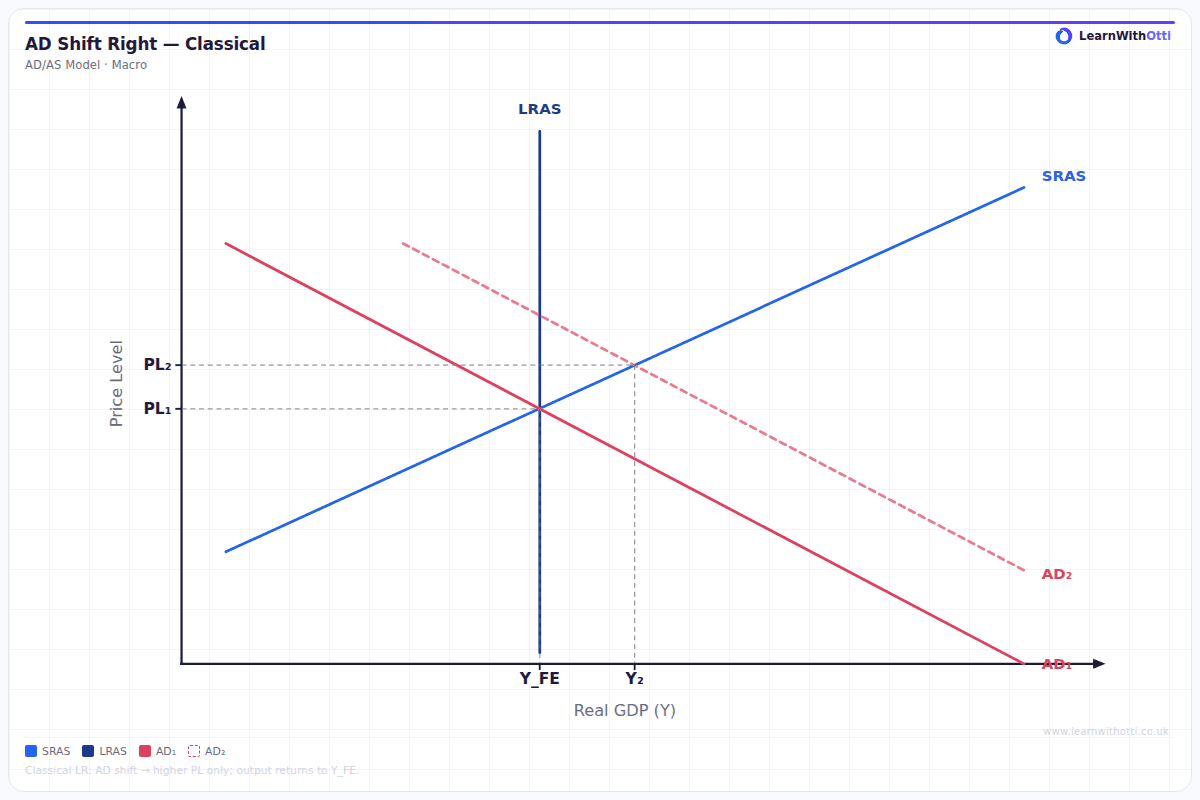
Evaluation: So the case for demand-side stimulus is strongest when there is a large negative output gap, and weakest when the economy is already operating close to capacity.
Demand-side policies in the Great Depression
The Great Depression followed the Wall Street Crash of 1929. Output fell sharply in many countries in the early 1930s and unemployment rose to very high levels. In the US, unemployment reached around a quarter of the labour force.
Different interpretations
- Keynesian view. The Depression was caused by a collapse in AD. Falling confidence cut consumption and investment, and the economy could stay stuck with mass unemployment because wages and prices did not adjust quickly. Keynes, in his General Theory of 1936, argued that governments should raise spending to replace the missing demand, even if this meant borrowing.
- Monetarist view. Milton Friedman and Anna Schwartz argued that the US Federal Reserve turned a downturn into a depression. Thousands of banks failed and the money supply fell by around a third, yet the Federal Reserve did not act to stop it.
Policy responses
- US. Early policy aimed to balance the budget, and in 1932 taxes were raised. From 1933, President Roosevelt's New Deal increased government spending on public works and job creation, and the US left the gold standard, allowing the money supply to grow. Recovery was real but slow, and unemployment stayed high for the rest of the decade.
- UK. In 1931 the government cut spending and raised taxes to balance the budget. Later that year the UK left the gold standard, so the pound fell in value, and in 1932 interest rates were cut to 2%, a period known as cheap money. Low interest rates helped a boom in house building in the mid-1930s.
Many economists later concluded that cutting spending and holding up interest rates during a collapse in demand makes the downturn worse.
Demand-side policies in the Global Financial Crisis of 2008
The crisis began in the US housing market, where many mortgages had been lent to borrowers who could not repay them. Losses spread through the banking system worldwide. Banks stopped lending to each other and to households and firms, confidence collapsed, and the UK and US fell into deep recessions.
Different interpretations
- Keynesian view. The crisis caused a collapse in AD, as consumption and investment fell. Governments should use fiscal stimulus to replace lost demand, and should not cut spending until recovery was secure.
- Concern about debt. Others argued that the crisis was caused by excessive borrowing, and that large budget deficits would push up government debt, undermine confidence and leave a burden for the future. On this view, governments should reduce deficits quickly once the immediate emergency was over.
- Monetary view. Many economists, drawing on Friedman and Schwartz, argued that the key lesson of the 1930s was to stop the banking system collapsing and the money supply shrinking, which pointed to rescuing banks and aggressive monetary easing.
Policy responses
- Monetary policy. The Bank of England cut Bank Rate from 5% in October 2008 to 0.5% by March 2009, and began QE. The US Federal Reserve cut its interest rate close to zero by December 2008 and also began large-scale asset purchases.
- Rescuing the banks. The UK government took Northern Rock into public ownership in 2008 and took large stakes in the Royal Bank of Scotland and Lloyds. The US government used public money to support its banks through the Troubled Asset Relief Program.
- Fiscal stimulus. The UK temporarily cut the standard rate of VAT from 17.5% to 15% from December 2008 to the end of 2009, and allowed automatic stabilisers to work, so the deficit rose sharply. The US passed a large stimulus package of extra spending and tax cuts in 2009.
- Austerity. From 2010, the UK government shifted to cutting the deficit through spending cuts and some tax rises, including raising VAT to 20% in 2011. Supporters argued it was needed to restore confidence in the public finances. Critics argued it slowed the recovery.
Recovery after 2008 was slow in both countries, and economists still disagree about how much this was due to the policy choices made.
Strengths and weaknesses of demand-side policies
Monetary policy: strengths
- Independence and credibility. Decisions are made by experts at the Bank of England, not politicians, so they are less likely to be shaped by elections. A credible target helps keep inflation expectations anchored.
- Flexible. Bank Rate can be changed at any of eight meetings a year, and changes can be made in small steps.
- Wide reach. Interest rates affect consumption, investment, asset prices and the exchange rate together.
Monetary policy: weaknesses
- Time lags. The full effect can take up to around two years.
- Limited when rates are near zero. Rates cannot be cut much below zero, which is why QE was used.
- Uncertain effect. If confidence is very low, households and firms may not borrow even when rates are low. Banks may not pass on cuts in full.
- Uneven impact. Interest rate rises hit borrowers, especially mortgage holders, while savers gain. A single rate is set for the whole UK, even if some regions are growing faster than others.
- Weak against cost-push inflation. Raising rates to bring down inflation caused by higher energy prices reduces output further.
Fiscal policy: strengths
- Direct effect on AD. Government spending adds to AD straight away, and works even when confidence is too low for interest rate cuts to have much effect.
- The multiplier can magnify the initial injection.
- Can be targeted. Spending and taxes can be aimed at particular regions, industries or income groups.
- Can raise capacity too. Spending on infrastructure, education and training also increases LRAS in the long run.
Fiscal policy: weaknesses
- Time lags. It takes time to recognise a problem, decide on a response, pass it through Parliament and carry out projects such as new roads.
- Budget deficits and debt. Expansionary policy usually increases borrowing and adds to the national debt, with higher interest payments in future.
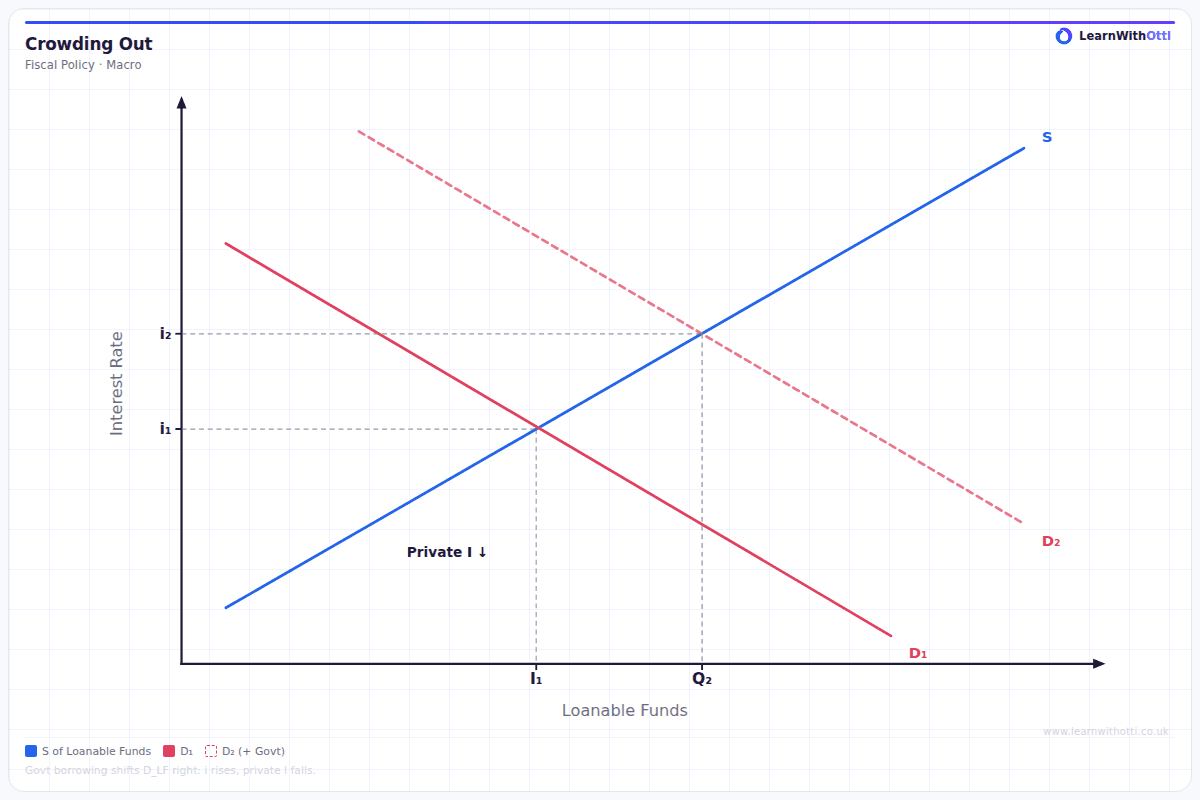
- Crowding out. If the government borrows heavily, it may push up interest rates, which reduces private sector investment and consumption. The rise in AD is then smaller than expected.
- Political pressures. Tax cuts and extra spending can be timed to win elections rather than to stabilise the economy.
- Size of the multiplier is uncertain. If households save tax cuts, or spend them on imports, the effect on AD is small.
For both policies, the effect depends on how much spare capacity there is, on the state of confidence, and on what is happening in the global economy. Demand-side policies cannot raise the economy's productive capacity in the way that supply-side policies aim to.
Key terms
| Term | Meaning |
|---|---|
| Monetary policy | The use of interest rates, the money supply and credit to influence AD |
| Fiscal policy | The use of government spending and taxation to influence AD |
| Bank Rate | The interest rate set by the Bank of England's MPC |
| Transmission mechanism | The channels through which a change in interest rates affects AD and inflation |
| Quantitative easing | The central bank creating money to buy assets, mainly government bonds |
| Monetary Policy Committee | The Bank of England committee of nine that sets Bank Rate and decides on asset purchases |
| Budget deficit | Government spending greater than government revenue in a year |
| Budget surplus | Government revenue greater than government spending in a year |
| National debt | The total amount owed by the government, built up from past deficits |
| Direct tax | A tax on income or wealth, such as income tax |
| Indirect tax | A tax on spending, such as VAT |
| Automatic stabilisers | Taxes and benefits that change with the economic cycle without any policy decision |
| Crowding out | Government borrowing raising interest rates and reducing private sector spending |
Common mistakes
- Saying the government sets interest rates. In the UK, the MPC of the Bank of England sets Bank Rate. The government sets the inflation target.
- Confusing the deficit with the debt. The deficit is borrowing in one year. The debt is the total owed.
- Shifting AS for a demand-side policy. Demand-side policies shift AD. Some fiscal measures, such as infrastructure spending, can also shift LRAS in the long run, but that is a separate effect.
- Ignoring spare capacity. The effect of a rise in AD on output and prices depends on where the economy is on the AS curve.
- Describing QE as printing banknotes. The money is created electronically and used to buy assets.
- Listing transmission channels without the chain of reasoning. Each link, from interest rates to spending to AD to output and prices, should be explained.
How this has been examined
In the Edexcel papers indexed on this site, this topic has appeared in six formats:
- 25-mark "Evaluate" essay — asked once (2021)
- 25-mark "Evaluate" synoptic essay — asked 4 times across 4 series (2020 to 2024)
- 12-mark "Discuss" data response — asked twice across 2 series (2017 to 2024)
- 5-mark "Explain" data response — asked once (2025)
- 4-mark "Draw" diagram — asked 4 times across 4 series (2018 to 2023)
- 1-mark multiple choice — asked twice across 2 series (2020 to 2023)
Where this goes next
The components of AD that these policies target are covered in 2.2.1 The characteristics of AD and 2.2.4 Government expenditure (G), and the multiplier in 2.4.4 The multiplier. The policies that aim to raise productive capacity instead are covered in 2.6.3 Supply-side policies, and the conflicts between policies in 2.6.4 Conflicts and trade-offs between objectives and policies. The wider role of the Bank of England is developed in 4.4.3 Role of central banks, and taxation and the public finances in 4.5.2 Taxation and 4.5.3 Public sector finances.
Otti is an AI tutor built for A-Level students. Ask it anything, practise exam questions, and get instant feedback written like an examiner would give it — not just right or wrong, but why.
Get one answer marked free